
B2B RevOps in 2026: What to Measure, What to Build, and Where Most Teams Stall
TLDR
- RevOps isn't a reporting function; it's an execution system that governs the data, processes, and handoffs connecting marketing, sales, and CS.
- Stop treating all RevOps objectives as equally urgent. Foundational objectives (data integrity, definitions) must precede growth-stage objectives (forecasting, expansion motions).
- Prove ROI to the C-suite with outcome metrics like Net Revenue Retention (NRR) and CAC Payback Period, not operational metrics like waterfall conversion rates.
- "RevTech debt"—the accumulated cost of an over-tooled GTM stack—degrades metrics by creating a false sense of precision that masks underlying data problems.
- The highest-leverage RevOps activity is owning the upstream data model (e.g., lead vs. contact architecture), as schema decisions determine the reliability of every downstream metric.
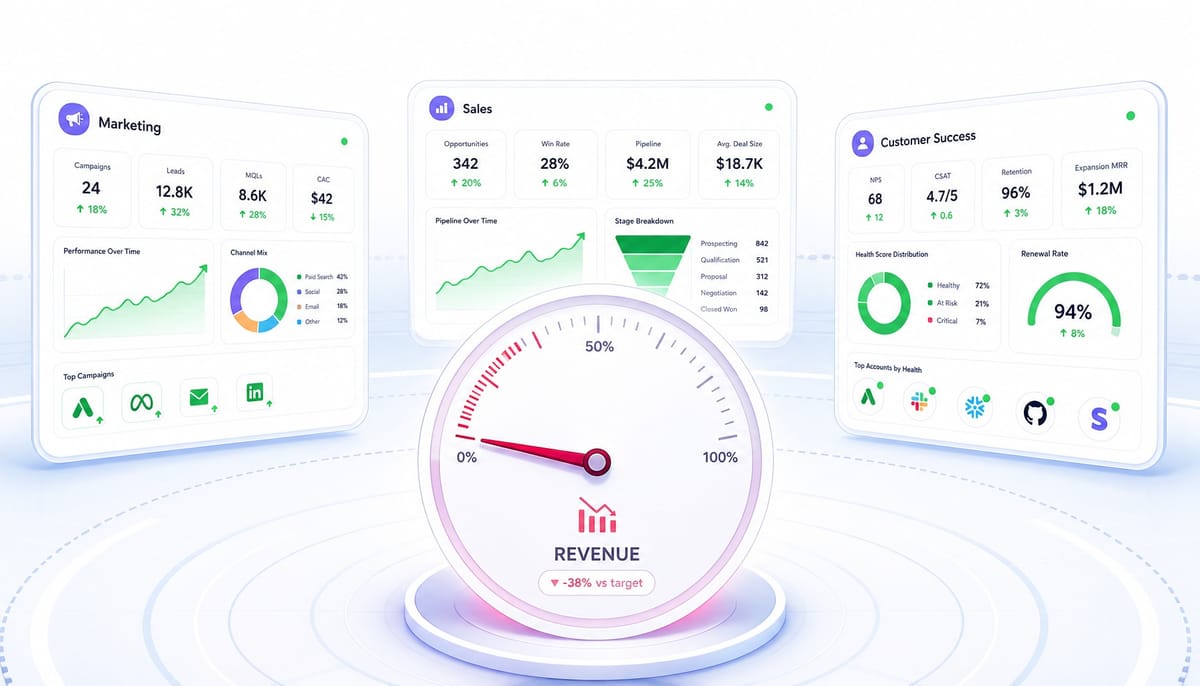
We've all seen the quarterly review. Marketing presents a chart showing 40% MQL growth. Sales follows with a pipeline coverage ratio of 3.5x. Customer Success closes with a healthy Net Revenue Retention (NRR) of 108%. Every GTM leader's dashboard is green. Yet, closed-won revenue is flat quarter-over-quarter.
The numbers don't reconcile because each team optimized its own metrics in isolation. The system connecting them is broken.
This is the core failure that B2B RevOps is meant to solve. But most teams build it backwards. They start with dashboards instead of designing the execution system that makes those dashboards trustworthy. RevOps is not an alignment initiative or a reporting function. It is the system that connects upstream activity to downstream revenue outcomes.
This guide explains how to build it correctly. We'll cover how RevOps objectives shift by company stage, which metrics actually correlate to revenue, and the two systemic problems—RevTech debt and data model neglect—that silently degrade everything RevOps is supposed to improve.
What B2B RevOps Actually Is (and What It Replaces)
Revenue Operations is the operating system layer that sits between marketing, sales, and customer success. It doesn't manage those functions; it manages the data, processes, and handoffs that connect them into a single revenue engine.
Consider the handoff vacuum in a siloed model. Marketing ops owns lead scoring. Sales ops owns pipeline stages. CS ops owns health scores. But nobody owns the conversion logic between them. A lead becomes an opportunity, which becomes a customer through a series of handoffs that no single team governs. RevOps governs those handoffs.
It replaces the coordination vacuum between GTM teams. According to Deloitte, companies with a unified RevOps function see significantly higher revenue growth, but that's a lagging indicator. The real reason to act is that without a central governor, every GTM team optimizes locally while revenue stagnates globally.
Gartner projects that 75% of the highest-growth B2B companies will deploy a RevOps model by the end of 2026. This isn't a trend to follow; it's an acknowledgment that scalable growth is a system design problem, not a functional hiring problem. RevOps is the discipline of designing that system.
How RevOps Differs From Sales Ops in a B2B Context
Sales ops optimizes one function's throughput—deal velocity, quota attainment, territory design. RevOps optimizes the system that connects all GTM functions to revenue outcomes. Sales ops asks, "How do we close more deals?" RevOps asks, "Why are deals marketing generates converting at 12% in segment A but only 3% in segment B, and what upstream data, process, or handoff failure explains the gap?"
Imagine win rates are dropping. The sales ops team responds by adjusting territory assignments. A RevOps team, however, traces the same symptom upstream. They discover that a change in lead scoring thresholds three months ago shifted the ICP mix entering the pipeline. The win rate drop is a marketing ops decision manifesting as a sales outcome.
This is the kind of cross-functional diagnosis that sales ops structurally cannot perform. It doesn't own the upstream data or the processes that generate it. Sales ops is chartered to optimize the sales motion; RevOps is chartered to optimize the entire revenue motion.
Core RevOps Objectives by Company Stage
The most common RevOps mistake is treating all objectives as equally urgent. A Series A company does not need predictive pipeline scoring; it needs clean data and agreed-upon stage definitions. A Series B company at $15M ARR doesn't need another data cleanup sprint; it needs cross-functional SLAs and a forecasting methodology leadership trusts.
According to Gartner, companies with advanced RevOps are twice as likely to exceed revenue goals, but this is the outcome of correct sequencing, not just having a RevOps function. We've all seen the $12M ARR SaaS company that invested in a tool like Clari for forecasting before standardizing its opportunity stage definitions. The tool produced confident-looking forecasts built on inconsistent data, and leadership lost trust in the numbers within two quarters.
The objectives are different because the execution constraints are different. This isn't a maturity model; it's a prioritization framework.
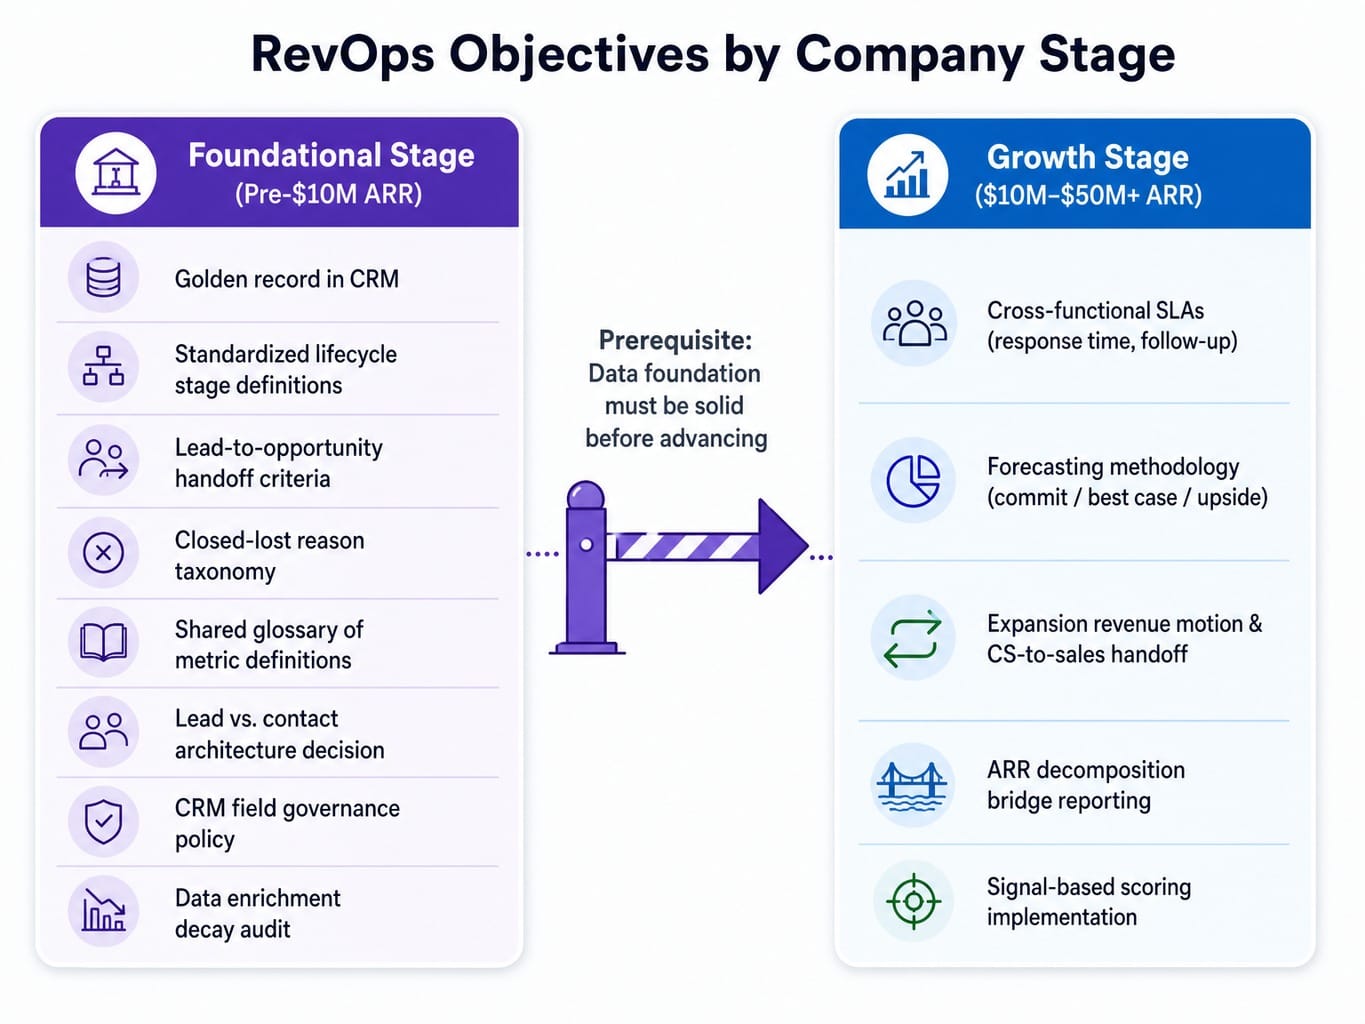
Foundational Objectives: Data Integrity, Definitions, and Process Documentation
The first RevOps objectives are unsexy but load-bearing. They are about establishing a single source of truth and a common language. This means creating a golden record in the CRM, standardizing lifecycle stage definitions across marketing and sales, documenting lead-to-opportunity handoff criteria, and building a closed-lost reason taxonomy that is actually enforced.
If marketing reports 500 MQLs and sales reports 200 SALs, the 60% drop-off isn't necessarily a quality problem—it's a definition problem. Marketing's MQL threshold doesn't match sales' acceptance criteria, and nobody documented the gap.
Specific deliverables here include a shared glossary of metric definitions, a clear decision on lead object vs. contact-based routing (a critical architectural choice in tools like HubSpot), a CRM field governance policy, and an audit of your data enrichment decay rate. Using tools like HubSpot Operations Hub for workflow automation and LeanData for routing logic helps enforce these foundational rules, turning them from theoretical policies into automated processes.
Growth-Stage Objectives: Cross-Functional SLAs, Forecasting, and Expansion Revenue
Once the data foundation is solid, RevOps objectives shift from hygiene to system orchestration. This is where you establish cross-functional Service Level Agreements (SLAs) with specific response time and follow-up commitments. You also implement a forecasting methodology that distinguishes between commit, best case, and upside, bringing discipline to the pipeline review.
A key growth-stage objective is building an expansion revenue motion. We often see companies where Customer Success identifies upsell signals but has no structured handoff to sales. Expansion revenue sits in a dead zone between two teams' OKRs.
This is where the ARR decomposition bridge (New Logo ARR + Expansion ARR - Contraction ARR - Churn = Net New ARR) becomes the RevOps operating system. It forces a holistic view of revenue. Tools like Clari can manage the forecast, Gong can provide conversational intelligence to flag deal risk, and platforms like ChurnZero can create the triggers for CS-driven expansion plays. At this stage, RevOps is no longer just reporting on the revenue engine; it's actively orchestrating it.
The Metrics That Prove RevOps ROI to the C-Suite
Most RevOps teams report the wrong metrics to the wrong audience. Internally, RevOps needs leading indicators that diagnose system health before revenue impact shows up. Externally, the C-suite needs outcome metrics that connect RevOps activity to revenue results.
I've seen RevOps leaders present detailed stage conversion rates to the board and get blank stares. They then reframed the same data as "we reduced the sales cycle by 11 days, which at our average deal size translates to $X in accelerated revenue" and got their budget approved. You must translate operational improvements into financial impact.
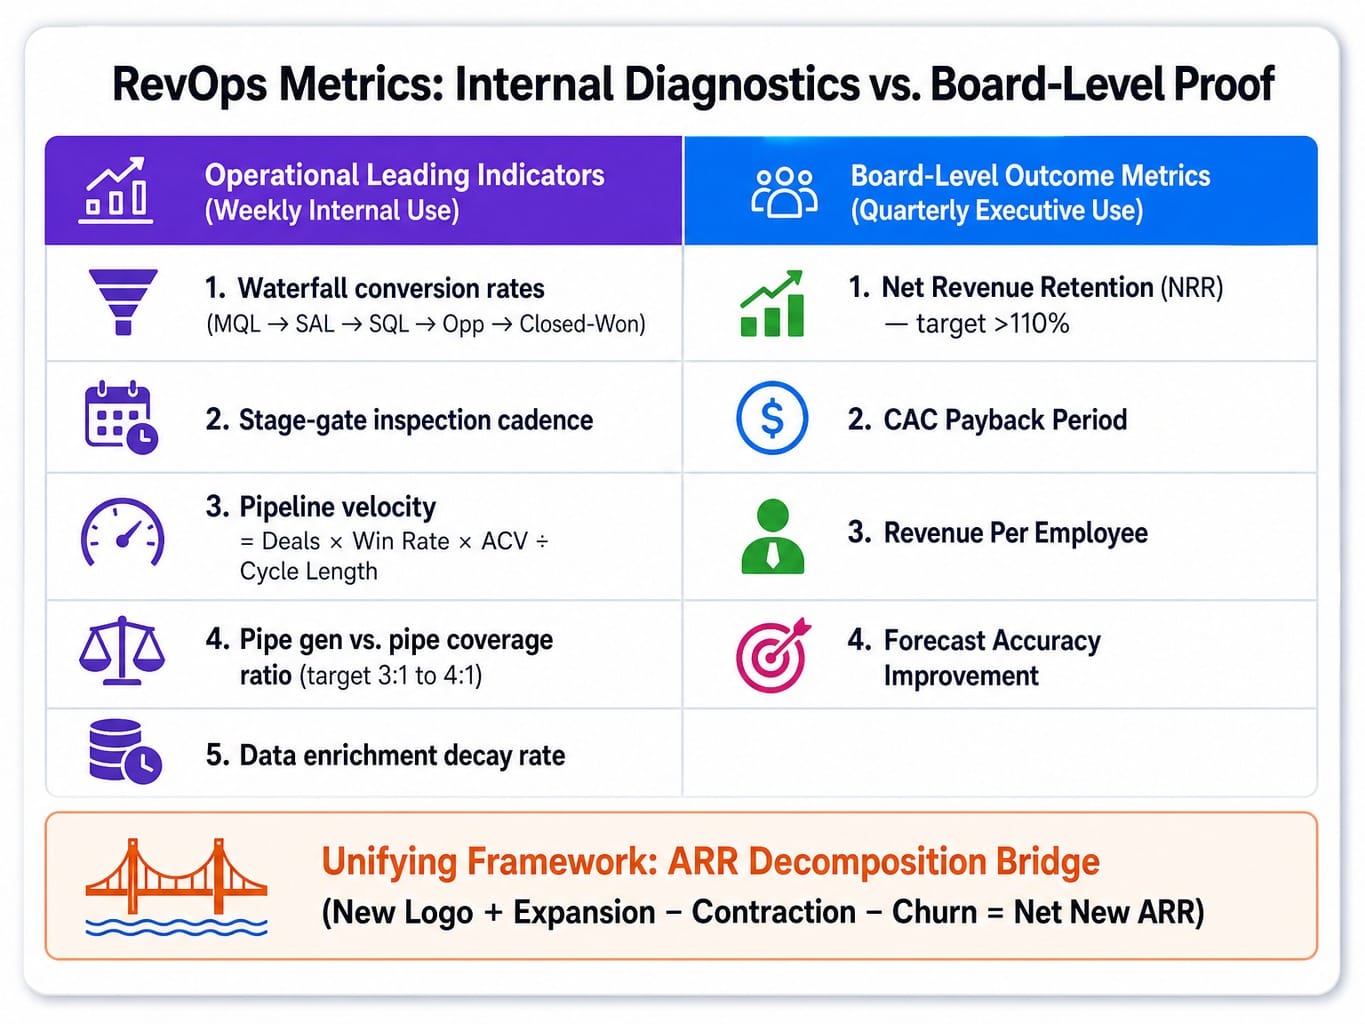
Operational Leading Indicators: What RevOps Uses to Diagnose System Health
RevOps should monitor a specific set of metrics weekly to detect system degradation before it hits the P&L. These are your internal gauges. They include:
- Waterfall conversion rates by stage (MQL → SAL → SQL → Opportunity → Closed-Won).
- Stage-gate inspection cadence to ensure opportunities aren't stagnating.
- Pipeline velocity (Number of Deals × Win Rate × Average Deal Value ÷ Sales Cycle Length).
- Pipe gen vs. pipe coverage ratio (typically aiming for 3:1 to 4:1 in B2B SaaS).
- Data enrichment decay rate.
If SAL-to-SQL conversion drops while MQL volume holds steady, the problem is likely a scoring or routing failure, not a demand gen failure. This is where the 2026 evolution of scoring comes in: moving from static demographic data to signal-based scoring that uses real-time behavioral signals from tools like Common Room or Clay.
Board-Level Outcome Metrics: What Proves RevOps Is Worth the Investment
The C-suite and board care about four metrics that directly connect RevOps to business value:
- Net Revenue Retention (NRR): Proves the post-sale handoff and expansion motion is working. Best-in-class SaaS companies exceed 110%.
- CAC Payback Period: Shows if the full-funnel conversion system is efficient, not just whether marketing generates leads.
- Revenue Per Employee: Reflects the operational leverage that is the core RevOps value proposition.
- Forecast Accuracy Improvement: Demonstrates the data integrity and process discipline RevOps delivers.
The ARR decomposition bridge (New Logo + Expansion - Contraction - Churn) is the single most powerful reporting framework for these conversations. It tells the complete story of how revenue is being generated, retained, and lost—the story RevOps is chartered to improve.
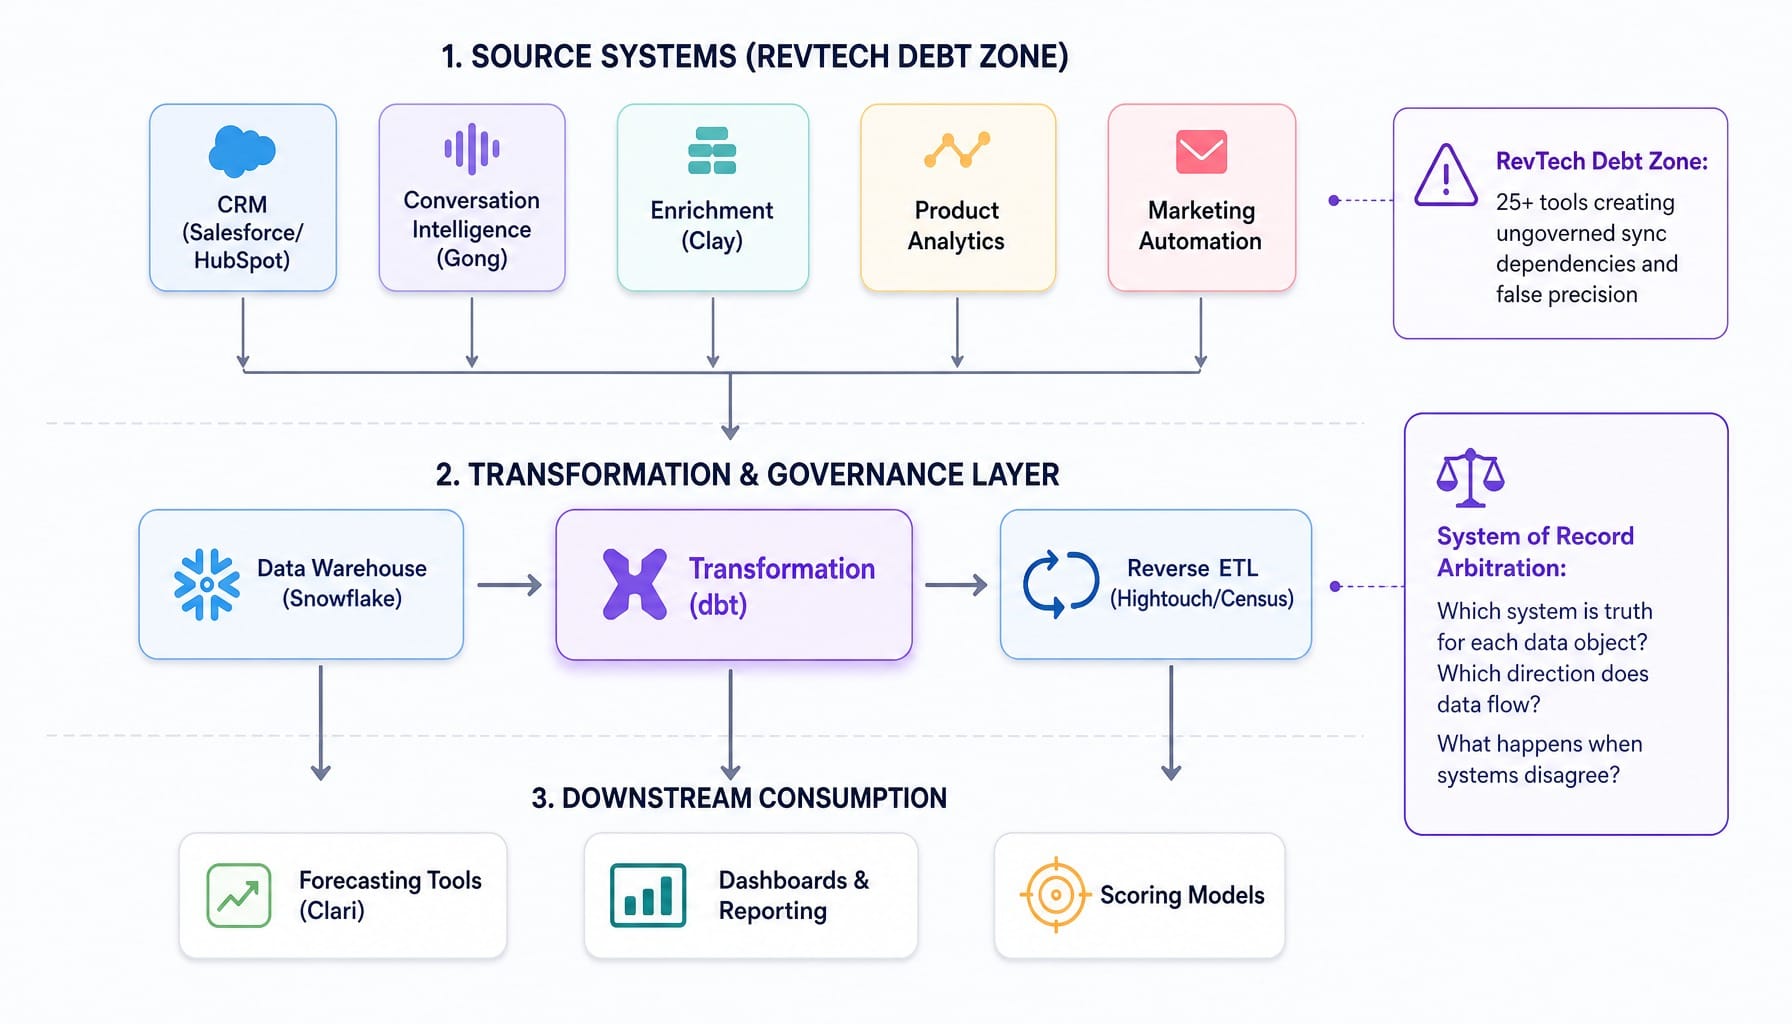
RevTech Debt: How Over-Tooled GTM Stacks Degrade the Metrics RevOps Is Supposed to Improve
RevTech debt is the accumulated cost of adding tools to the GTM stack without retiring, integrating, or governing them. It's analogous to technical debt in engineering. The Pedowitz Group found the average B2B company has over 25 tools in its sales stack alone, and this is often a liability, not an asset.
Here's the counterintuitive part: adding tools like Gong for conversation intelligence or Clay for enrichment doesn't automatically improve RevOps metrics if the underlying CRM data is inconsistent. Each new tool creates new data flows, sync dependencies, and failure points. They don't degrade metrics directly; they create a false sense of precision that masks underlying data problems.
For example, a company adds a pipeline forecasting tool that ingests opportunity data from Salesforce. It produces a weighted pipeline number that looks authoritative. But 30% of opportunities have no close date, 15% haven't been updated in 60+ days, and stage definitions vary by sales team. The forecast is mathematically precise and operationally meaningless.
The diagnostic approach is to perform a system of record arbitration before adding any new tool. Determine which system is the source of truth for each data object, which direction data flows, and what happens when systems disagree. Using reverse ETL tools like Hightouch or Census, with a transformation layer like Snowflake and dbt, enforces data consistency before it reaches downstream tools.
Why RevOps Should Own the Data Model, Not Just the Dashboards
Most RevOps teams inherit a data model they didn't design and spend their careers building dashboards on top of it. This is backwards. The schema decisions made upstream determine the reliability of every metric RevOps reports downstream. If the data model is wrong, no amount of dashboard engineering can fix the output.
Take a company using a lead-based routing model in HubSpot, where every form fill creates a new lead record. Marketing reports 10,000 "new leads" per quarter. But 40% are duplicate contacts from existing accounts—customers downloading content. The lead number is inflated, the MQL-to-opportunity conversion rate is artificially depressed, and the CAC calculation is wrong.
The fix isn't a better dashboard; it's a contact-based data model with proper account association logic.
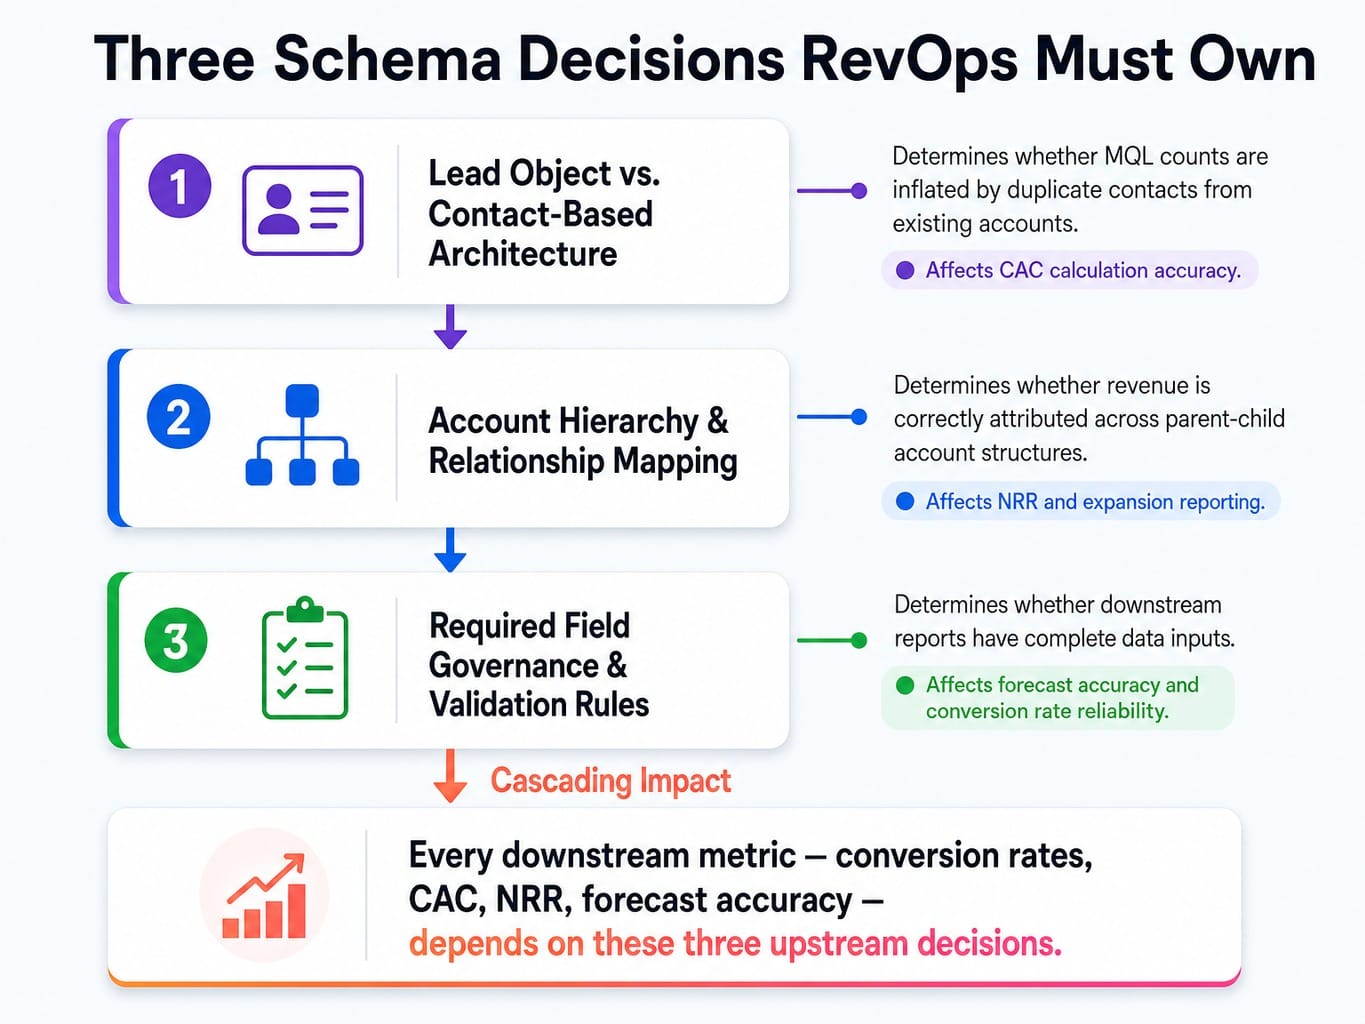
RevOps must own three specific schema decisions:
- The lead object vs. contact-based architecture.
- Account hierarchy and relationship mapping.
- Required field governance and validation rules.
These decisions, made within platforms like Salesforce Revenue Cloud or HubSpot Operations Hub, are the highest-leverage RevOps activities most teams neglect. They are architectural choices that define the integrity of the entire revenue system.
When RevOps Exposes More Problems Than Your Team Can Ship Fixes For
Effective RevOps requires continuous diagnosis across data, processes, and handoffs. But for lean teams, this creates a new bottleneck: the execution bandwidth to act. A sharp RevOps leader can identify that lead scoring needs recalibration, landing pages are underconverting, or the website's conversion flow has friction. Shipping those fixes, however, requires engineering tickets, agency briefs, and cross-functional coordination that stretches for weeks.
This is the execution gap. Diagnosis outpaces implementation.
Spike AI closes that gap. It's not another RevOps tool for diagnosis; it's the execution layer that acts on it. Spike AI continuously identifies the highest-impact conversion and website optimization opportunities across your funnel, then executes them in weekly sprints—without engineering dependencies. For RevOps teams that have built the diagnostic capability but lack the execution bandwidth, Spike AI functions as the implementation arm that turns insights into compounding weekly improvements. RevOps identifies the problem; Spike AI ships the fix. The cycle repeats every week, not every quarter.
See how Spike AI turns RevOps insights into weekly shipped improvements
From Reporting Function to Execution System
The fundamental shift is this: RevOps is not a reporting function that builds dashboards. It is an execution system that owns the connective tissue between GTM functions. Its effectiveness is determined by three things most teams underinvest in: stage-appropriate objective sequencing, revenue-correlated metric selection, and upstream data model ownership.
The companies that get RevOps right don't start with tools. They start with definitions, handoff logic, and data architecture, then layer metrics and orchestration on top. The RevOps teams that will outperform in 2026 are the ones that stop measuring activity volume and start measuring the velocity and reliability of their execution system.
Frequently Asked Questions
What does a RevOps org chart look like at a $10M ARR B2B SaaS company?
At $10M ARR, most B2B SaaS companies run RevOps with 1-2 people: a RevOps manager owning the CRM and reporting, plus a data analyst handling integrations. Marketing, sales, and CS ops may still sit within their departments, but RevOps coordinates shared definitions and handoff SLAs. The RevOps lead typically reports to the CRO or CEO to maintain functional neutrality.
Which KPIs should a brand-new RevOps function track in its first 90 days?
In the first 90 days, focus on three diagnostic KPIs: CRM data completeness rate (are required fields populated?), lead-to-opportunity handoff time (how long until sales follows up?), and closed-lost reason fill rate (are we learning from losses?). These three metrics expose the foundational gaps in data quality, process speed, and feedback loops that everything else depends on.
Should RevOps report to the CRO, the CFO, or the CEO?
RevOps should report to whoever owns the full revenue number—typically the CRO or CEO. Reporting to a single function head (e.g., VP of Sales) creates structural bias and turns RevOps into a glorified functional ops team. The reporting line signals organizational intent; if you want RevOps to enforce cross-functional standards, it must have cross-functional authority.
How do you set cross-functional SLAs between marketing, sales, and customer success?
Start with the two highest-friction handoffs: MQL-to-sales follow-up and opportunity-to-CS onboarding. For each, define the trigger event, the response time commitment, and the escalation path for missed SLAs. Publish these as a shared document, not a slide deck, and measure compliance weekly. SLAs that aren't measured decay within 30 days.
How should RevOps teams approach AI-driven pipeline scoring in 2026?
The shift is from static demographic scoring (title + company size) to dynamic, signal-based scoring that incorporates real-time behavioral data from tools like Common Room or 6sense—website visit patterns, content engagement, and product usage. RevOps owns the scoring model architecture. The critical task is validating that scoring changes correlate to downstream win rate improvements, not just MQL volume.
What are the most common RevOps mistakes that stall B2B SaaS growth?
Three mistakes account for most stalls: (1) building dashboards before standardizing the metric definitions, resulting in numbers nobody trusts; (2) buying tools to solve process problems, which creates integration complexity without fixing the workflow; (3) optimizing for activity metrics (emails sent) instead of conversion quality metrics (stage-to-stage conversion rates). Each mistake compounds the others.