
MQL to SQL Conversion Rate: 2026 Benchmarks and the Funnel Gaps That Distort Them
TLDR
- Your blended MQL to SQL conversion rate is a vanity metric. Actionable insights come from segmenting by lead source channel and ACV tier, which reveal wildly different conversion profiles.
- A good inbound organic MQL-to-SQL rate is 28-40%, while content syndication often converts at just 5-12%. Averaging them hides both the win and the waste.
- Most teams are missing the Sales Accepted Lead (SAL) stage. Tracking MQL-to-SAL acceptance separately from SAL-to-SQL qualification is the only way to diagnose if the bottleneck is marketing lead quality or sales process.
- If your conversion rate is dropping, check your speed to lead first. A lead contacted in 5 minutes is 21x more likely to qualify than one contacted after 30 minutes—a variable that matters more than perfecting your lead scoring model.
- High-ACV deals ($100k+) naturally have lower MQL-to-SQL rates (8-18%) than low-ACV deals (25-35%) due to stricter qualification and longer cycles. Comparing your rate to a generic benchmark is meaningless without this context.
Your marketing team reports a 22% MQL to SQL conversion rate in the quarterly review. The Head of Sales nods, the CEO jots it down. Someone asks, "Is that good?"
The honest answer is that the number is meaningless.
It's meaningless because your inbound organic MQLs—the lifeblood of the business—are quietly converting at 38%. At the same time, the expensive paid webinar program you just tripled down on is converting at 9%. The 22% blended rate obscures both the high-performing engine you must protect and the resource drain you need to fix.
Most marketing teams track MQL-to-SQL as a single, monolithic metric. But a single number cannot tell you what to fix. It's an output of your marketing execution system, not a diagnostic tool. This guide provides the segmented benchmarks and diagnostic frameworks to move beyond blended averages and find the real levers for pipeline growth.
What MQL to SQL Conversion Rate Actually Measures (and Why Definitions Break Benchmarks)
The formula for MQL to SQL conversion rate is simple: (Total Sales Qualified Leads ÷ Total Marketing Qualified Leads) × 100. The inputs, however, are anything but standard. The fatal flaw in most benchmarking exercises is assuming that an MQL at your company means the same thing as an MQL at another.
It doesn't.
An MQL at one B2B SaaS company might be a lead who visited the pricing page twice and matches a strict Ideal Customer Profile (ICP). At another, it's anyone who downloaded a top-of-funnel whitepaper. Likewise, SQL definitions range from "a BDR has confirmed budget and timeline" to "an AE simply agreed to take the meeting."
Consider two companies:
- Company A: Defines an MQL based on a lead scoring model that weighs firmographics and high-intent behaviors. An SQL is only created after a BDR has a discovery call and confirms the lead meets BANT criteria. They report an 18% MQL-to-SQL rate.
- Company B: Defines an MQL as any form fill on a gated asset. An SQL is created the moment a BDR sends the first outreach email. They report a 35% MQL-to-SQL rate.
Company B's rate looks better, but it's an illusion created by loose definitions. Their downstream SQL-to-Opportunity rate is likely abysmal. This is why widely cited industry averages, which often range from 13% to 30%, are directionally interesting but operationally useless without context. Before you benchmark against any external number, you must first audit your own funnel stage definitions, lead scoring model, and sales disposition codes.
Why Your Blended MQL-to-SQL Rate Is Hiding Actionable Signal
A blended MQL-to-SQL rate is a reporting metric, not an operating metric. It's useful for a high-level slide deck, but it can't tell you what to do on Monday morning to improve the pipeline. To get an operating metric, you have to decompose that average across the two dimensions that drive B2B SaaS growth: lead source and deal size.
Breaking down the blended average reveals where your marketing execution system is performing efficiently and where it's leaking resources.
Conversion Rate by Lead Source Channel
Not all MQLs are created equal. An MQL generated from a high-intent search query is fundamentally different from one acquired through a content syndication list. Lumping them together masks the true performance of your channels.
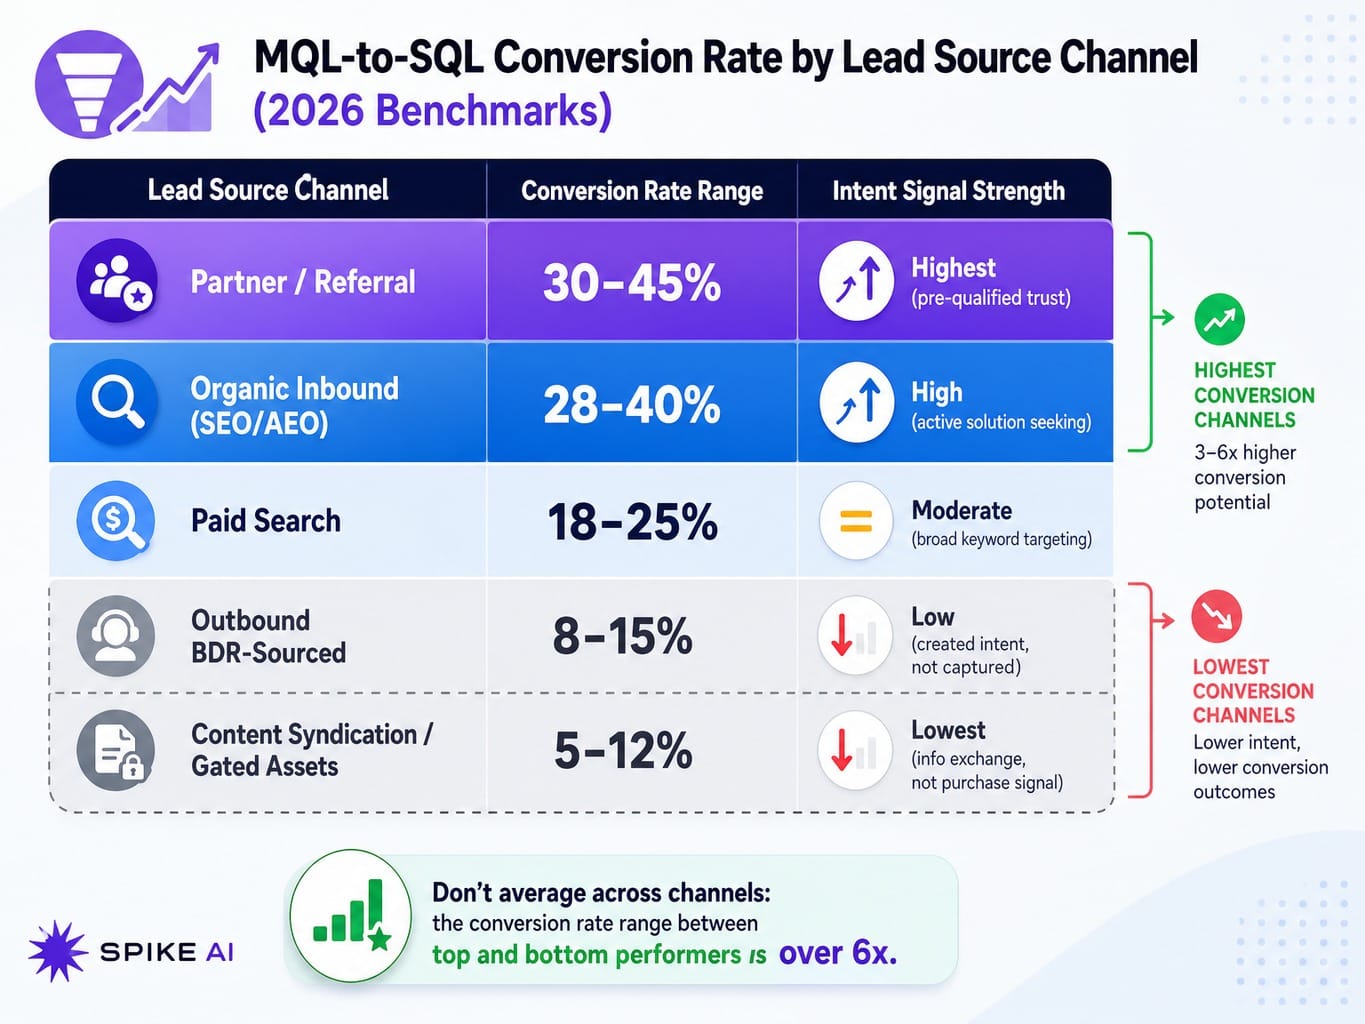
Here are realistic MQL-to-SQL conversion benchmarks for 2026, segmented by common B2B SaaS channels:
- Partner/Referral: 30-45%. These leads arrive with implicit trust and are often pre-qualified by the referring partner, leading to the highest conversion rates.
- Organic Inbound (SEO/AEO): 28-40%. These leads have actively sought out a solution to a problem, demonstrating strong buying intent that translates to high qualification rates.
- Paid Search: 18-25%. Intent is still present, but broader keyword targeting and ad-driven journeys mean qualification is less certain than with organic search.
- Outbound BDR-Sourced: 8-15%. With no prior inbound signal, the BDR is creating intent, not just capturing it. Conversion rates are naturally lower and depend heavily on targeting and messaging.
- Content Syndication/Gated Assets: 5-12%. These leads traded their contact information for an asset, not to signal purchase intent. They require significant nurturing to become sales-ready.
If your blended rate is 20%, but your organic inbound converts at 38% and content syndication at 7%, you don't have a single conversion problem. You have a channel mix and investment problem. Effective lead source attribution and contact-to-account matching are the foundational capabilities needed to unlock this level of insight.
Read more: Marketing Channel Prioritization for 2026: Where Your Budget Actually Compounds
Conversion Rate by ACV Tier
Just as lead source matters, so does the size of the potential deal. The rigor of your qualification process—and therefore your conversion rate—should scale with the Average Contract Value (ACV) of the deal.
- Sub-$10k ACV: 25-35%. Sales cycles are short, buying decisions are simple, and qualification criteria are often lighter. The goal is velocity.
- $10k - $50k ACV (Mid-Market): 18-28%. More stakeholders and a more considered purchase process introduce friction, lowering the rate.
- $50k - $100k ACV: 12-22%. At this level, formal buying committees and budget scrutiny become standard, filtering out a higher percentage of MQLs.
- $100k+ ACV (Enterprise): 8-18%. Strict qualification against budget, authority, need, and timeline (BANT) is non-negotiable. MQLs without a clear, funded project behind them rarely make it to the SQL stage.
Comparing your enterprise MQL-to-SQL rate against a benchmark that includes self-serve and low-ACV SaaS products is an exercise in futility. Your lower rate is not a sign of failure; it's a reflection of a more complex and rigorous sales process. Metrics like average deal cycle length and pipeline coverage ratio provide necessary context.
The SAL Stage Most Teams Skip—and How It Changes Your Reported Rates
Most funnels show a direct handoff from Marketing to Sales: MQL → SQL. This two-stage view is clean, simple, and hides the most common point of failure in the entire revenue engine. The reality is a three-stage process, and the missing step is the Sales Accepted Lead (SAL).
A SAL is an MQL that a BDR or AE has reviewed and officially accepted to work. Without this stage, you cannot distinguish between two fundamentally different problems:
- Marketing is sending unqualified leads (a low MQL-to-SAL acceptance rate).
- Sales is failing to convert good leads (a low SAL-to-SQL qualification rate).
And let's be honest, this is where most marketing-sales finger-pointing starts. The SAL stage replaces blame with data. It's a diagnostic layer that pinpoints the true bottleneck.
What the SAL Stage Reveals About Marketing-Sales Alignment
Mechanically, the SAL stage is a simple status change in your CRM. After Marketing generates an MQL, it enters a queue for Sales review. A rep then either accepts it, turning it into a SAL, or rejects it with a specific disposition code (e.g., 'Wrong ICP,' 'Not a decision-maker,' 'Duplicate').
The MQL-to-SAL acceptance rate—sometimes called the 'working rate'—becomes the primary measure of marketing-sales alignment.
- A healthy rate is 60-80%. This indicates Marketing's definition of "qualified" largely matches what Sales is willing to work.
- Below 50% signals a problem. Your lead scoring is likely miscalibrated, or your ICP definition has drifted from what Sales is actually selling to.
- Above 90% can also be a red flag. It may mean your MQL criteria are too loose and Sales is accepting everything without proper filtering, pushing the qualification burden downstream.
This metric, governed by the SLA between marketing and sales, forces a productive conversation about lead quality based on data, not anecdotes. It's the foundation for a healthy lead recycling program and a clear understanding of disqualification taxonomy.
Before and After: How SAL Tracking Changes Your Funnel Math
The impact of adding a SAL stage is immediate and profound. It doesn't change your overall pipeline, but it completely reframes where you focus your improvement efforts.
Before SAL Tracking:
- You generate 1,000 MQLs.
- Sales converts 200 of them to SQLs.
- Your reported MQL-to-SQL rate is 20%. The natural conclusion: Marketing needs to generate better leads.
After Inserting a SAL Stage:
- You generate 1,000 MQLs.
- Sales accepts 700 of them. Your MQL-to-SAL acceptance rate is 70% (healthy).
- Of those 700 SALs, Sales converts 200 to SQLs. Your SAL-to-SQL qualification rate is 29%.
The blended 20% rate is the same, but the diagnosis is entirely different. The problem isn't marketing lead quality; the MQL-to-SAL rate proves that. The bottleneck is the sales qualification process between acceptance and SQL. Your improvement lever shifts from 'generate better MQLs' to 'improve BDR discovery scripts and qualification rigor.'
Five Reasons Your MQL-to-SQL Rate Is Declining (and Where to Look First)
A falling MQL-to-SQL rate triggers alarm bells, often aimed squarely at the marketing team. But the root cause is rarely as simple as "bad leads." Here is a diagnostic checklist to identify the real system constraint.
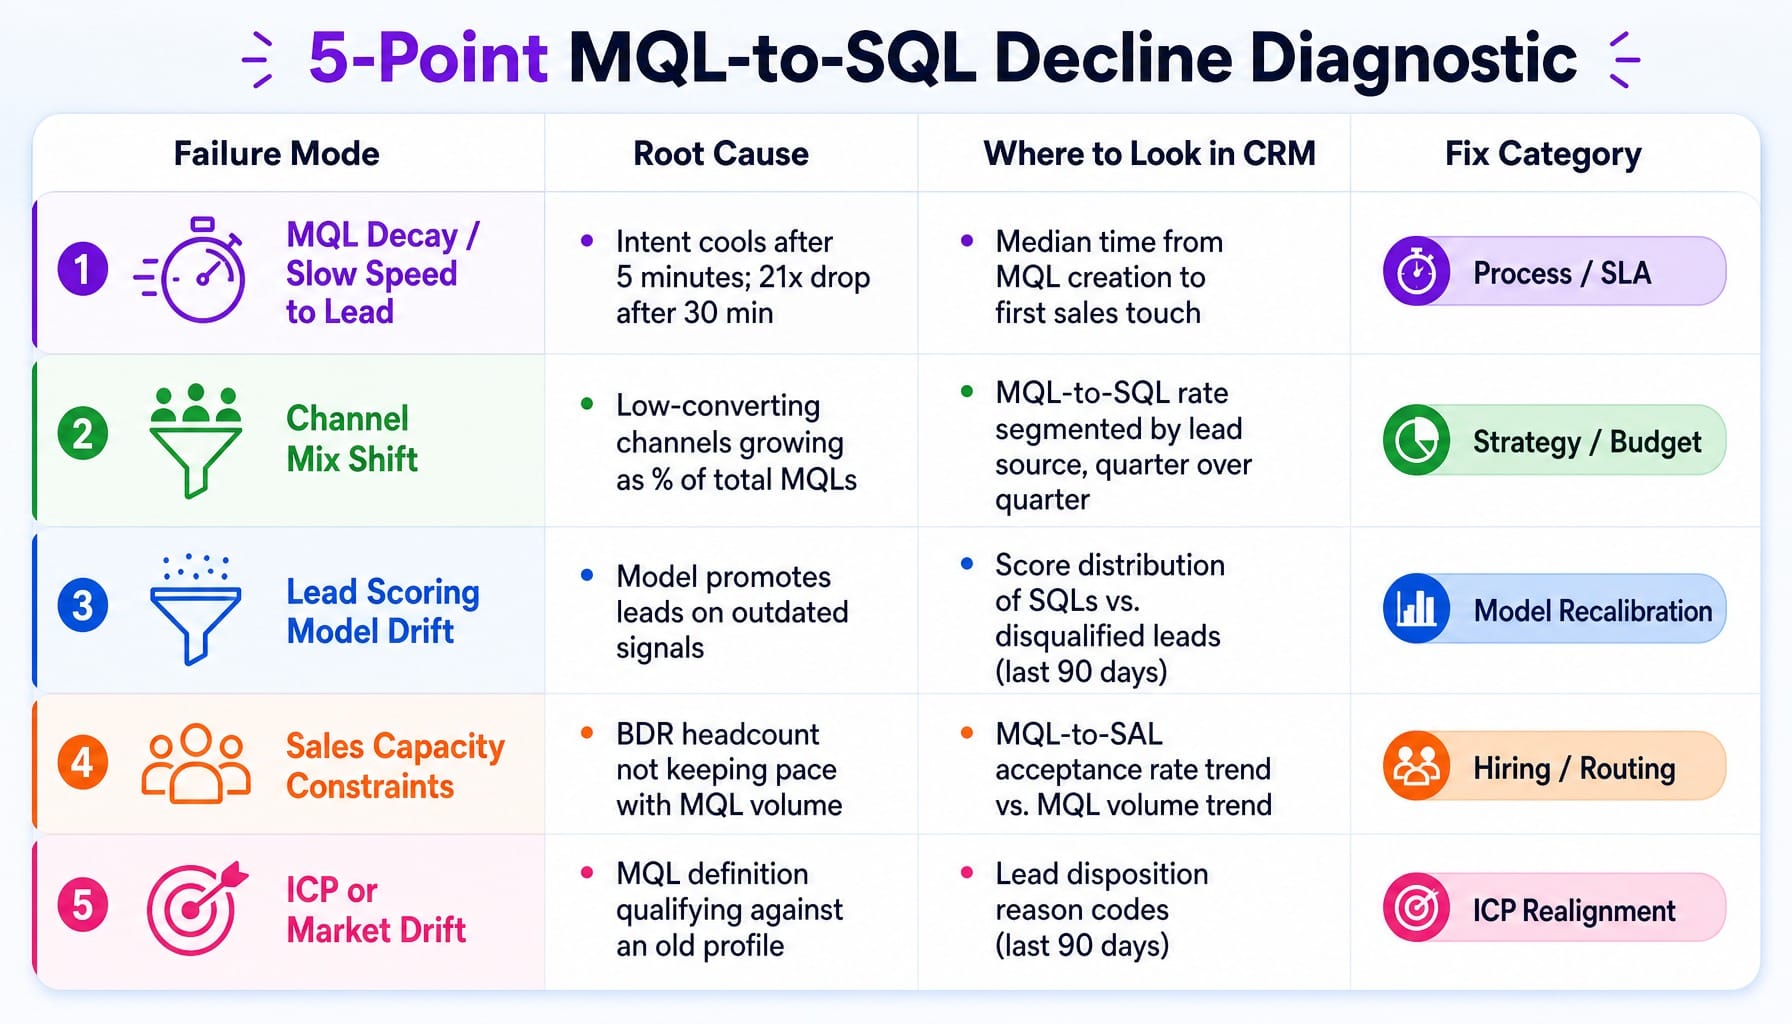
- MQL Decay and Slow Speed to Lead. Intent cools rapidly. A lead's score is highest the moment they take an action. If they sit in the MQL stage for days before outreach, their propensity to convert plummets. Research shows leads contacted within 5 minutes are 21x more likely to qualify than those contacted after 30 minutes.
Where to look: Measure the median time from MQL creation to the first sales touch in your CRM. If it's over 24 hours (or even 1 hour), you have an SLA breach rate problem, not a lead quality problem.
- A Shift in Channel Mix. Your blended rate will drop if lower-converting channels (like content syndication) grow as a percentage of your total MQL volume, even if your high-intent channels (like organic search) are performing better than ever.
Where to look: Segment your MQL-to-SQL rate by lead source and compare the channel mix this quarter to the last.
- Lead Scoring Model Drift. Your scoring model was built six months ago. Since then, your ideal customer has evolved, but the model hasn't. It's now promoting leads based on outdated signals, leading to a disconnect with what sales considers qualified.
Where to look: Analyze the lead score distribution of all leads that became SQLs in the last 90 days versus those that were disqualified. If the patterns are nearly identical, your model has lost its predictive power.
- Sales Capacity Constraints. Your marketing engine is scaling, but BDR headcount isn't keeping pace. MQL volume is up, but each rep is overloaded. Leads go unworked or get a cursory touch, and the working rate declines.
Where to look: Check your MQL-to-SAL acceptance rate. If it's dropping while MQL volume is rising, sales capacity is likely the bottleneck.
- ICP or Market Drift. Your product has moved upmarket, or a new competitor has changed the landscape. The MQL definition, however, is still qualifying leads against an old profile. Sales is disqualifying them because they no longer fit.
Where to look: Analyze your lead disposition reasons over the last 90 days. A spike in codes like 'Wrong industry,' 'Company too small,' or 'No budget' points directly to an ICP misalignment.
Speed to Lead Predicts SQL Conversion Better Than Lead Score Accuracy
Marketing and RevOps teams spend months refining complex lead scoring models, tweaking points for every esoteric behavior in pursuit of the "perfect" MQL. This effort is often misplaced. The single highest-leverage variable in MQL-to-SQL conversion is not the precision of the score, but the speed of the response.
While the median B2B response time remains a staggering 42 hours, the data is clear: the odds of qualifying a lead drop dramatically after just five minutes.
Lead scoring determines which leads to prioritize. Speed to lead determines whether those prioritized leads convert. A perfectly scored MQL, reflecting stacked intent signals from platforms like 6sense or Demandbase, is worthless if it's contacted 48 hours later. A moderately scored MQL contacted in under five minutes while they are still on your website is infinitely more valuable.
The operational implication is clear: before you invest another cycle in refining your lead scoring model, measure your median speed to lead. If it's over an hour, fixing your lead routing and notification system will produce a greater lift in your MQL-to-SQL rate than any scoring adjustment. Tools like Qualified or ChiliPiper exist to compress this latency, turning a manual process into an automated, instantaneous handoff.
When the Bottleneck Isn't Knowledge—It's Shipping the Fix
This article has laid out a clear diagnostic path. You know you need to segment your conversion rates, implement a SAL stage, diagnose the root cause of decline, and compress your speed to lead. The problem for most lean marketing teams isn't knowing what to do; it's the inability to ship the fixes.
Each diagnosis creates a new backlog item: reconfigure CRM workflows, update lead scoring logic, build new reports, optimize landing pages, and adjust sales process automation. These changes get stuck in a queue, bottlenecked by limited developer resources, fragmented tools, and the sheer operational drag of day-to-day campaign execution. The latency between identifying the fix and deploying it eats weeks, and the funnel continues to leak.
Read more: Marketing Task Prioritization for Lean Teams: A Framework That Actually Works
This is the execution gap Spike AI is built to close. We function as the execution layer that turns your prioritized backlog into weekly shipped improvements. Instead of just diagnosing the conversion problem, Spike AI deploys the solution—fusing SEO, CRO, and ad optimizations into a single, closed-loop system. We help you move from analysis to action, ensuring that the insights you gain from your data are translated into deployed changes that compound over time.
See how Spike AI turns your conversion backlog into weekly shipped improvements
Conclusion
The MQL to SQL conversion rate is not a single number to be benchmarked against a generic industry average. It's a composite signal of your entire go-to-market execution system. It only becomes actionable when you decompose it.
Teams that improve this metric don't chase a magic number. They build a system of inquiry. They segment by channel and ACV to find the real pockets of performance. They insert a SAL stage to isolate failure modes between marketing and sales. They run diagnostics to find the root cause of decline, looking at process constraints like speed to lead before blaming lead quality.
The next time someone in your organization asks, "What's our MQL-to-SQL rate?"—ask them back: "For which channel, which ACV tier, and are we counting SALs?"
That question is worth more than any single answer.
Frequently Asked Questions
Should product-led growth companies track MQL-to-SQL conversion differently?
Yes. In PLG motions, the Product Qualified Lead (PQL)—a user showing buying intent through product usage—often replaces or supplements the MQL. Tracking MQL-to-SQL alongside PQL-to-SQL separately reveals whether marketing-generated or product-generated leads drive more pipeline. This directly informs where to invest resources for the most efficient growth.
How does average contract value affect SQL-to-closed-won conversion rates?
Higher ACV deals (>$100k) typically have lower SQL-to-closed-won rates of 12-18% due to multi-stakeholder committees, longer cycles, and intense competition. Sub-$10k ACV deals can close at 25-35% because decision-making is simpler. Benchmarking your average SQL to closed won conversion rate B2B SaaS without ACV segmentation is directionally misleading for both enterprise and SMB motions.
How do intent data platforms like 6sense or Demandbase impact MQL-to-SQL rates?
Intent data can improve MQL-to-SQL rates by adding account-level buying signals (like topic research surges or competitor comparisons) to traditional lead scores. This allows teams to prioritize accounts showing active interest. However, if MQL criteria are tightened to only include these accounts, the rate may inflate artificially while lead volume drops, potentially hurting overall pipe gen if not managed carefully.
What is the average number of touches before an MQL converts to SQL?
For most B2B SaaS deals, an MQL requires 6-8 touches across email, phone, and social to be qualified or disqualified. Enterprise deals with ACVs over $50k often need 10-14 touches. The critical factor is velocity; compressing those touches into the first 7-10 days yields significantly higher conversion than spreading them over a month due to rapid intent decay.
How do you calculate pipeline velocity from MQL through closed-won?
Pipeline velocity is calculated as: (Number of SQLs × Win Rate % × Average Deal Value $) ÷ Average Sales Cycle Length in Days. This metric connects your MQL-to-SQL rate to actual revenue impact. A team can have a high conversion rate but low velocity if deals are small or cycles are long, making velocity a more comprehensive health metric for executive reporting.