
How to Prioritize Marketing Activities for ARR: A Revenue-First Framework for SaaS Teams

TLDR
- Replace vanity metrics like MQLs with ARR-connected indicators: CAC payback period, spend-to-pipe ratio, and stage-2 pipeline creation.
- Build a simple scorecard to rank every marketing activity by its incremental ARR per dollar, payback speed, and contribution to your pipeline coverage ratio.
- Balance your budget between demand capture (for short-term ARR) and demand generation (for long-term pipeline) based on your ARR stage and "magic number."
- Detect when a channel is hitting diminishing returns by plotting monthly spend against monthly net-new pipeline; cap spend at the inflection point.
- Re-evaluate your prioritization quarterly at minimum, but move to a monthly review cadence once you cross the $10M ARR threshold.
Your three-person marketing team is running SEO, paid search, a webinar series, and a new partner program. At the quarterly review, you report that all four activities "influenced pipeline." But when the CMO asks which one you should double down on to hit next quarter's annual recurring revenue target, the room goes quiet. The default answer? Whichever channel generated the most MQLs.
This is the universal failure mode of SaaS marketing prioritization: we measure activity volume, not revenue contribution. We spread ourselves thin across a dozen initiatives, unable to prove which one actually moved the needle on net-new ARR last quarter. We know we should be investing in what works, but our attribution models are set up to credit everything, making it impossible to decide what to cut.
The only defensible way to prioritize marketing activities is by their measurable, attributable impact on ARR. This isn't a strategy problem; it's a measurement and execution discipline. This guide provides a practical model for ranking every marketing initiative by its actual contribution to recurring revenue. You'll learn the specific metrics that replace vanity signals and get guidance on the hardest trade-offs, from demand generation versus capture to net-new versus expansion revenue.
Why Most SaaS Marketing Prioritization Defaults to Gut Feel
Most SaaS marketing teams don't prioritize activities by revenue impact. They prioritize by recency bias, channel familiarity, or whoever was loudest in the last planning meeting. This isn't a failure of intent; it's a failure of the underlying measurement architecture.
Consider a typical $8M ARR SaaS company with a three-person marketing team. Last quarter, they ran SEO, paid search, and a series of co-marketing webinars. All three show up in HubSpot as having "influenced" the $180K in net-new ARR that actually closed. When the budget gets cut by 20%, which channel do they scale back? They can't answer, because their data tells them everything is working a little bit.
This paralysis stems from three root causes:
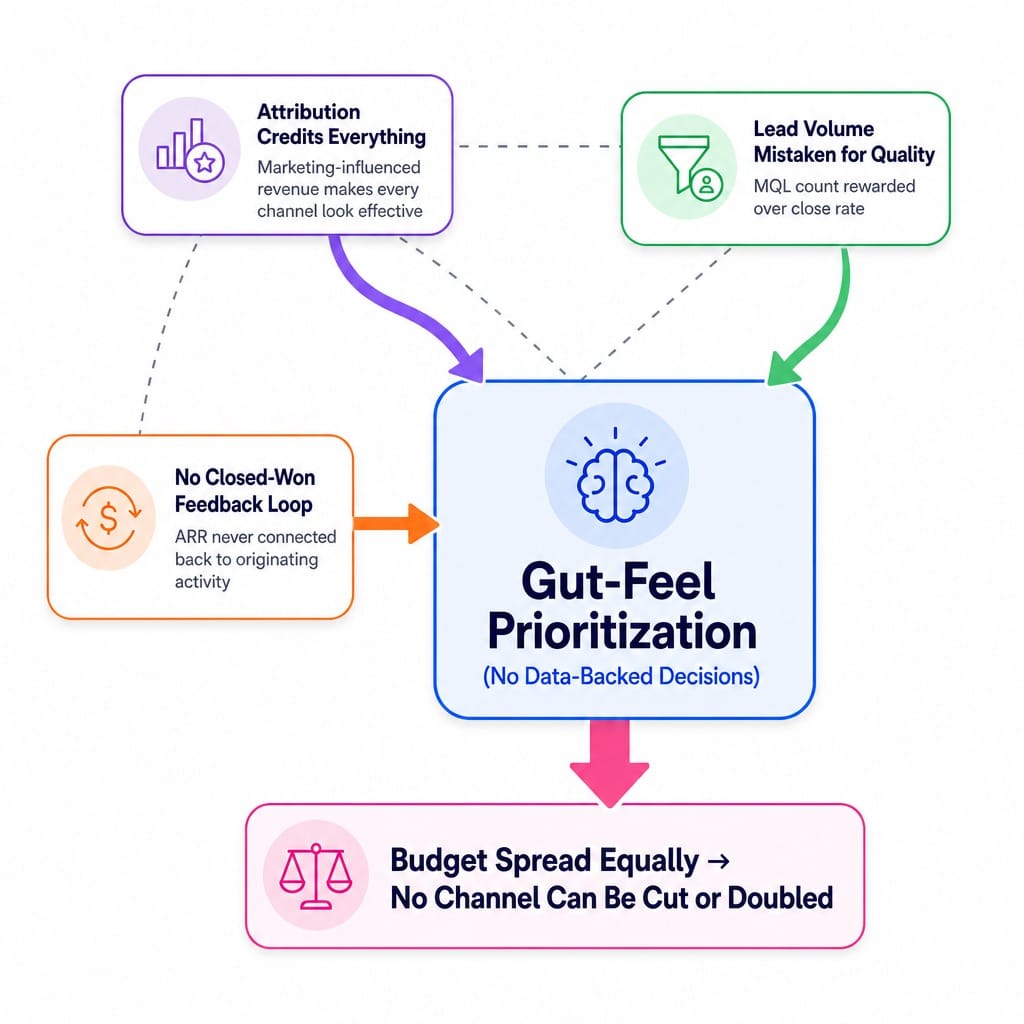
- Attribution is set up to credit everything. The "marketing-influenced revenue" metric is the primary culprit. When every touchpoint gets credit, no single activity can be isolated as the source. The critical split between what marketing sourced versus what it merely influenced is rarely enforced, rendering the data useless for making hard choices.
- Lead volume is mistaken for pipeline quality. Teams measure MQLs or even Sales Accepted Leads (SALs) instead of qualified pipeline. A channel that generates 500 MQLs with a 2% close rate looks better in a standard dashboard than a channel generating 50 MQLs with a 20% close rate. This consistently leads to overinvestment in high-volume, low-quality channels. It's a major reason why average B2B website conversion rates still hover around 2% despite massive investment in marketing tools.
- There is no feedback loop from closed-won revenue. The final outcome—a signed deal and its ARR value—is rarely connected back to the specific marketing activity that initiated the opportunity. Instead, marketers look at top-of-funnel metrics, sales looks at bottom-of-funnel metrics, and no one connects the two to calculate a simple, brutal metric: incremental ARR per marketing dollar. Corrective signals like self-reported attribution ("How did you hear about us?") are often collected but rarely used to challenge the flawed model.
Your prioritization problem isn't about finding a better strategy. It's about fixing the measurement system that forces you to rely on gut feel.
The Metrics That Actually Connect Marketing Activities to ARR
Prioritizing marketing activities for ARR requires replacing vanity metrics like impressions, click-through rates, and MQL volume with a small set of revenue-connected indicators. These metrics, found within your CRM and revenue tools like HubSpot, Salesforce, or Dreamdata, shift the core question from "How much activity did we generate?" to "How much recurring revenue did each activity contribute per dollar and hour invested?"
This isn't about building a complex multi-touch attribution model that no one trusts. It's about focusing on a handful of metrics that reveal which activities create pipeline that actually closes at your target ACV. Top-performing SaaS companies often target a marketing efficiency ratio (MER) above 5x—if your overall marketing isn't hitting that, it's likely because spend is misallocated to low-impact channels.
Efficiency Metrics: CAC Payback, Spend-to-Pipe Ratio, and MER
Raw Customer Acquisition Cost (CAC) is a misleading signal. A channel with a $500 CAC and a 6-month payback period is far more valuable to a cash-conscious business than one with a $400 CAC and a 14-month payback. Efficiency is about both cost and speed.
- CAC Payback Period (by Channel): This is the number of months it takes to recover the fully loaded acquisition cost from a customer acquired through a specific channel. It's your primary risk signal. A channel with a long payback period puts a strain on cash flow, even if its raw CAC seems low.
- Spend-to-Pipe Ratio: Calculated as total channel spend divided by the ACV-weighted pipeline it generated in a period. This is the ultimate leading indicator of efficiency. It tells you which channel creates the most pipeline value per dollar, long before those deals close. As a rule of thumb, if a channel's spend-to-pipe ratio is below 3x, it's likely not generating enough pipeline to justify its budget share.
- Marketing Efficiency Ratio (MER): This is your board-level metric, calculated as total revenue divided by total marketing spend. While it's a blended, portfolio-level metric, tracking it provides a high-level check on whether your prioritization decisions are improving overall business efficiency.
Pipeline Quality Metrics: SAL-to-SQL Conversion and Stage-2 Pipeline Creation
Pipeline volume is a trap. It's the single most common reason SaaS teams over-invest in the wrong channels. A high volume of low-quality leads that churn out of the funnel is a net drain on both marketing and sales resources.
- SAL-to-SQL Conversion Rate: This metric reveals whether a channel's leads actually progress past initial qualification. A channel generating 200 Sales Accepted Leads (SALs) per month but converting only 4% to Sales Qualified Leads (SQLs) is less valuable than one generating 40 SALs at a 25% conversion rate. But most dashboards will tell you the opposite. This is your first filter for pipeline quality.
- Stage-2 Pipeline Creation: This is the most important leading indicator of future ARR. It measures opportunities that have passed the initial discovery call and entered active evaluation. This filters out the noise of unqualified leads and early-stage pipeline that never converts. Tools like Clari or HockeyStack are built to surface this data, but you can track it in any CRM. When prioritizing, you should always weigh a dollar of stage-2 pipeline higher than a dollar of stage-1 pipeline.
Read more: Data-Driven CRO Strategies: Identifying Marketing Opportunities for True Conversion Optimization
A Practical Prioritization Framework Tied to ARR Targets
A marketing prioritization framework for ARR should score each activity across three dimensions: efficiency, risk, and pipeline contribution. This approach replaces generic models like ICE or RICE, which were designed for product feature prioritization and lack the revenue-specific inputs needed to make marketing budget decisions.
The goal is to stack-rank every initiative—from a specific paid search campaign to your entire content marketing program—and allocate budget proportionally to the top performers.
Let's walk through an example. A team is evaluating three channels: SEO content, paid search campaigns, and partner webinars. Historically, they split the budget equally. Using an ARR-focused framework, they score each channel. SEO content scores highest on incremental ARR per dollar but has the longest payback period. Paid search has the shortest payback but is showing signs of diminishing returns. Partner webinars score highest on pipeline coverage ratio because they generate a high volume of leads. The final composite score reveals a completely different allocation than gut feel would suggest.
Building the Scorecard: Three Inputs That Replace Gut Feel
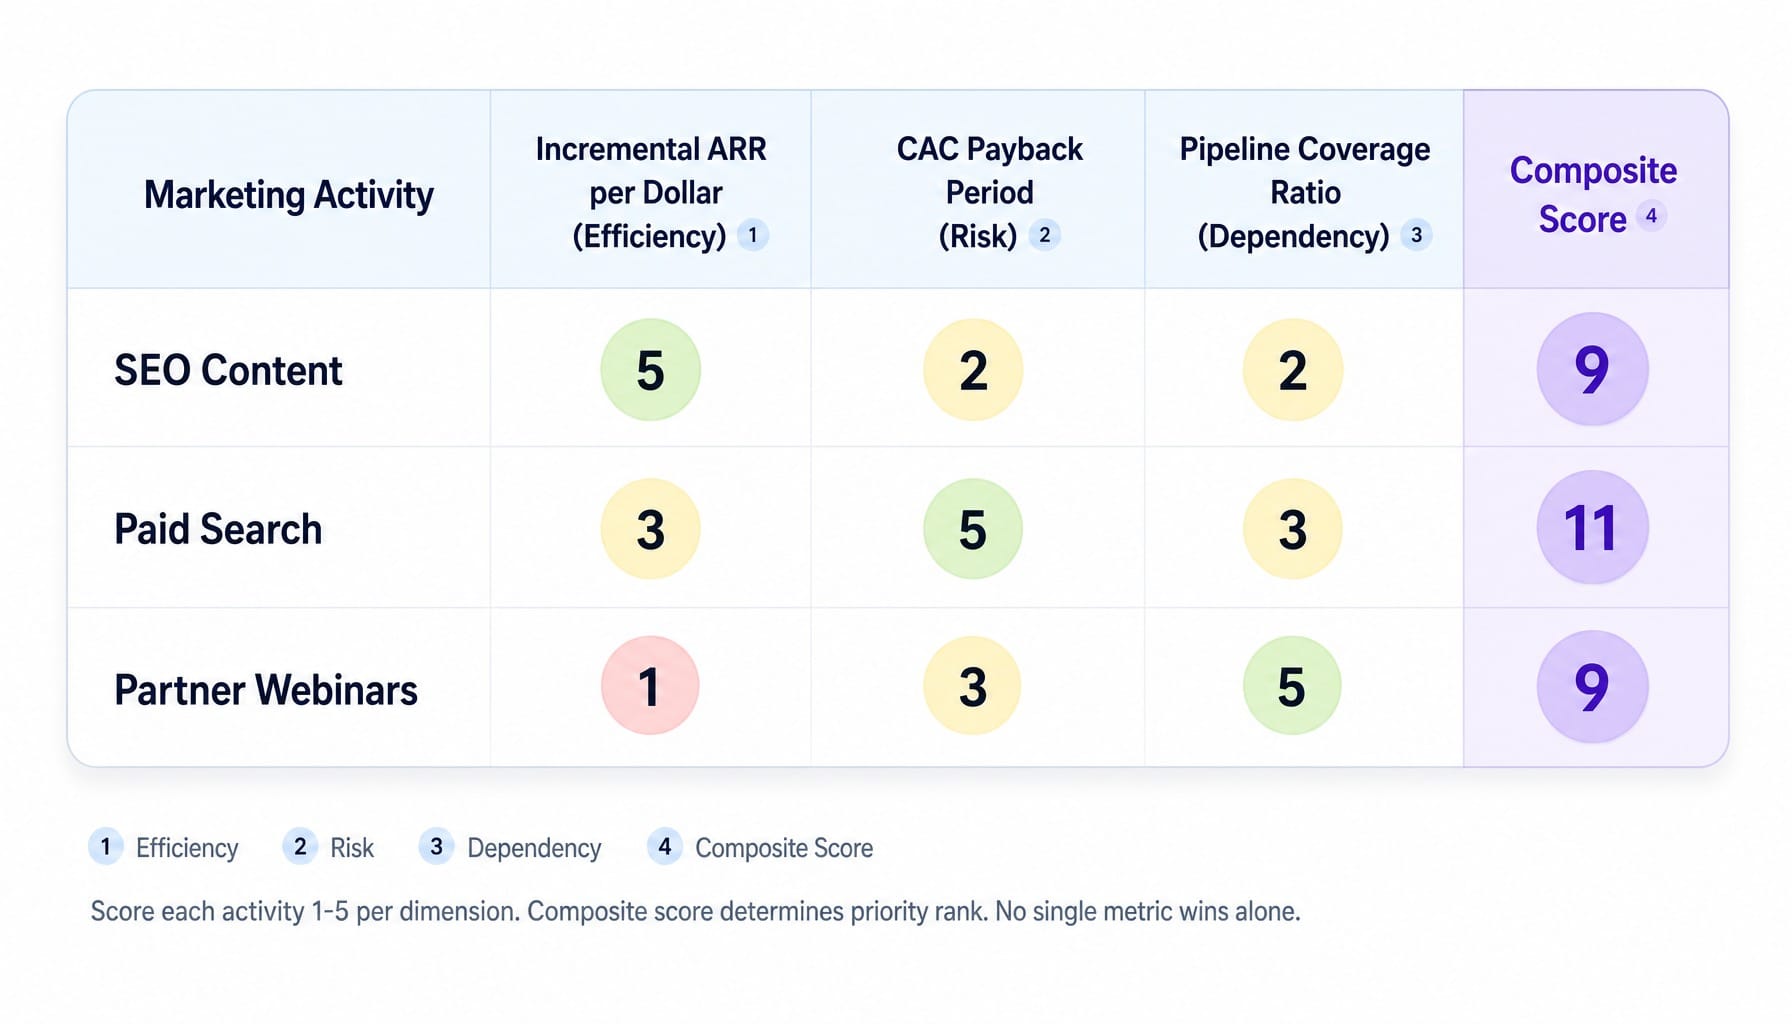
You can build this in a simple spreadsheet. For each marketing activity or channel you're evaluating, score it from 1-5 across these three dimensions:
- Incremental ARR per Marketing Dollar (Efficiency): This is the total new ARR attributable to the channel divided by the total channel spend. It's your core efficiency signal. A score of 5 goes to the channel with the highest return; a 1 goes to the lowest.
- CAC Payback Period (Risk): This is the number of months to recover the acquisition cost from that channel's customers. It's your primary risk signal. A score of 5 goes to the channel with the shortest payback period.
- Pipeline Coverage Ratio Contribution (Dependency): This measures how much of the pipeline needed to hit next quarter's ARR target this channel supplies. It's your dependency signal. If you need $1M in pipeline and a channel provides $400k, its contribution is 40%. A score of 5 goes to the channel providing the largest share of qualified pipeline.
The composite score (the sum of the three ratings) determines the priority rank. No single metric wins; a channel can be efficient but supply too little pipeline to matter, or it can supply a massive pipeline but with an unsustainable payback period.
Applying the Framework: How Allocation Shifts When You Score by ARR
Let's return to our example team. Before, they split their budget equally. After applying the scorecard, the results are counterintuitive.
The partner webinars, which everyone "felt" were the best channel because they generated the most MQLs, scored lowest on incremental ARR per dollar. Why? Their SAL-to-SQL conversion rate was a dismal 6%. The leads were plentiful but unqualified.
Conversely, the SEO content program, which the team considered cutting due to its slow start, scored highest on efficiency. Its pipeline, while smaller and slower to build, closed at 3x the rate of any other channel, resulting in a much higher contribution to incremental ARR per dollar spent.
The framework's conclusion was clear: cap the budget for partner webinars, maintain paid search spend at its current level (due to diminishing returns), and reallocate the saved budget to double down on creating more high-intent SEO content. The power of the framework lies in its ability to surface these surprising, data-backed truths that challenge your team's assumptions.
Demand Generation vs. Demand Capture: Which Drives ARR Faster at Your Stage
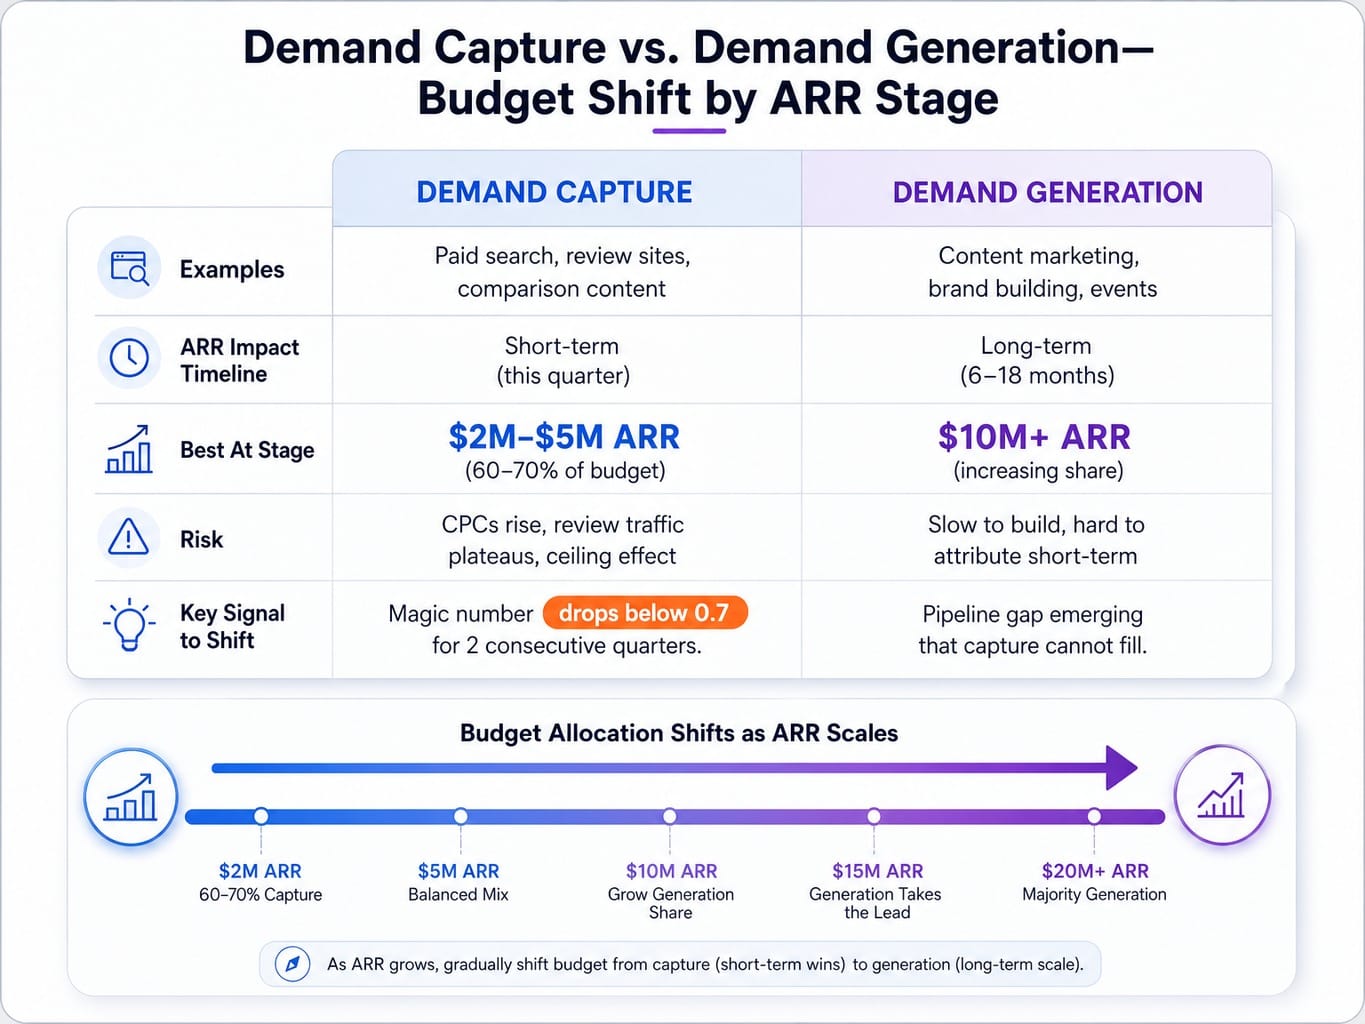
The most strategic prioritization trade-off isn't between channels; it's between two types of activity. Demand capture (like paid search, review sites, and comparison content) drives ARR faster in the short term by converting existing intent. Demand generation (like content marketing, brand building, and events) builds the pipeline that sustains ARR growth over the next 6-18 months.
The right balance depends entirely on your ARR stage and pipeline coverage ratio.
At $2M-$5M ARR, most teams should weigh their budget 60-70% toward demand capture. The priority is to prove unit economics and close the intent that already exists before investing heavily in creating new awareness.
However, a funny thing happens on the way to $20M ARR. Demand capture channels hit a ceiling. Paid search CPCs rise, review site traffic plateaus, and the cost to capture the next customer skyrockets. Teams that failed to invest in demand generation earlier suddenly find themselves with a pipeline gap they can't close quickly.
The key signal that your capture channels are saturating is the "magic number": your net new ARR in a quarter divided by the previous quarter's total sales and marketing spend. Top-quartile SaaS companies maintain a magic number above 1.0. If yours drops below 0.7 for two consecutive quarters while spend is flat or increasing, your capture engine is running out of fuel. This is the moment to aggressively shift budget toward demand generation. Tools like 6sense or Demandbase can help bridge this gap by identifying in-market accounts, but they don't replace the need for a long-term demand generation engine.
Detecting Diminishing Returns Before Your Metrics Show It
The biggest prioritization mistake isn't choosing the wrong channel; it's staying too long on a channel that has already peaked. Most teams detect diminishing returns one or two quarters too late because they track lagging indicators like closed-won ARR instead of leading ones.
The pattern is subtle. A channel's total pipeline continues to grow because cumulative spend is growing, but the marginal pipeline generated per additional dollar spent is declining. This is invisible in standard dashboards that only show absolute numbers.
Here's a simple diagnostic you can run this week: plot monthly spend against monthly net-new stage-2 pipeline for each of your major channels over the last four quarters. If the curve is flattening or bending downward while spend is increasing, that channel is in the zone of diminishing returns.
For example, a team was spending $40k/month on paid search. At $30k/month, it generated $600k in stage-2 pipeline. But at $40k/month, it only generated $650k. That incremental $10k in spend produced only $50k in pipeline, a massive drop in efficiency compared to the $200k per $10k increment at lower spend levels.
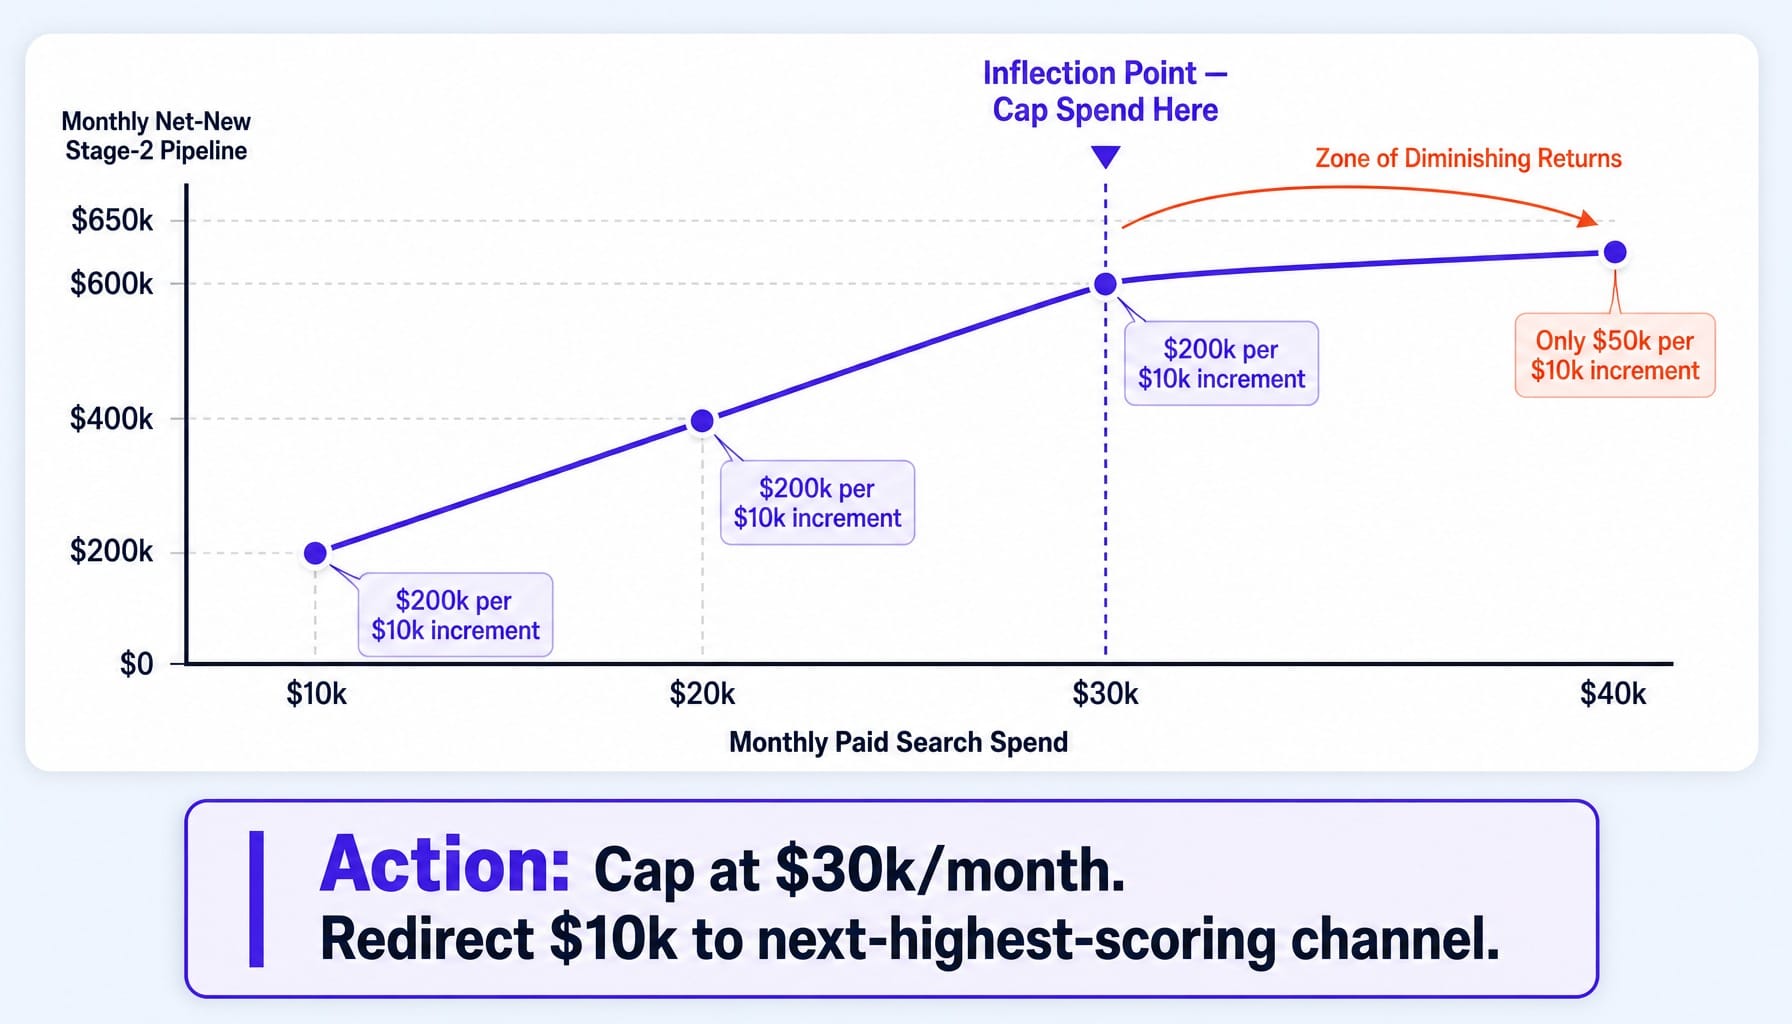
The correct response is not to cut the channel entirely. It's to cap spend at the inflection point and redirect the incremental budget to the next-highest-scoring channel from your prioritization framework. Ignoring this signal and continuing to pour money into a saturated channel leads to a regression to baseline, where more spend yields progressively worse results.
How Often to Re-Prioritize as ARR Scales
Re-evaluate your marketing activity prioritization quarterly at a minimum. However, the cadence should accelerate as your ARR scales. Monthly reviews become necessary once you cross the $10M ARR mark because channel dynamics, competitive pressures, and saturation points shift much faster at higher spend levels.
At $3M ARR, a team might be running 3-4 primary channels. The data is often thin, and quarterly review is sufficient to make informed decisions without overreacting to noise.
At $15M ARR, that same team is likely running 6-8 channels with significant spend. There's enough data flowing through the system to detect diminishing returns, seasonal patterns, and competitive shifts on a monthly basis. Using waterfall metrics to track how pipeline moves through stages over time makes these monthly reviews actionable rather than just reactive.
But beware the opposite failure: re-prioritizing too frequently. Weekly shifts based on noisy, short-term data can lead to strategic whiplash, preventing any channel from reaching statistical significance or compounding its effects.
A practical rule: review your prioritization scorecard monthly, but only reallocate a significant budget when a channel's composite score changes by more than 20% for two consecutive months. This provides a balance between agility and stability.
When the Framework Is Clear but the Bandwidth to Execute It Isn't
This article has laid out a clear system: you now have the metrics, the framework, and the cadence to prioritize marketing activities for ARR. But this reveals a deeper tension. The very reason most teams default to gut feel is a lack of bandwidth. A lean marketing team that now knows the right framework still faces the same constraint: executing against it requires continuous measurement, re-prioritization, and shipping changes across SEO, CRO, and paid channels every week.
Knowing what to prioritize is necessary, but it's not sufficient. The compounding effect on ARR comes from actually shipping against that top priority, measuring the result, and letting it inform the next move. Unifying marketing goals with task execution is where most lean teams break down.
This is where Spike AI closes the gap between insight and execution. It functions as the system that continuously identifies the highest-impact move across your website, SEO, and ads—then executes it for you. This doesn't replace your judgment; it operationalizes it. The marketer moves from being an operator buried in a backlog to an orchestrator who approves the highest-value work. Spike AI turns your prioritization framework into a weekly shipping cadence, ensuring the most important thing actually gets done.
See how Spike AI turns your marketing priorities into weekly shipped improvements
Conclusion
Prioritizing marketing activities for ARR is not a one-time strategy exercise; it is a continuous measurement and execution discipline. Most teams are trapped by metrics that measure activity, not revenue, forcing them to rely on instinct.
The fix is a fundamental shift in your operating system. It starts with adopting a small set of ARR-connected metrics—CAC payback, spend-to-pipe ratio, and stage-2 pipeline creation—to build a simple scoring framework. It requires the discipline to re-evaluate that framework monthly and the courage to act on its findings, even when they contradict your gut.
The SaaS teams that compound ARR fastest are not the ones with the most elaborate strategy decks. They are the ones with the tightest feedback loop between spend, pipeline, and revenue. They identify the single highest-impact change they can make each week, they ship it, and they let the results re-prioritize the next sprint. That relentless cadence is the engine of growth.
Frequently Asked Questions
How do I calculate which marketing channel contributes the most to ARR?
Divide the total closed-won ARR sourced by each channel (using first-touch or self-reported attribution) by the total spend on that channel over the same period. This gives you incremental ARR per marketing dollar. Supplement this with the channel's SAL-to-SQL conversion rate to ensure its pipeline quality justifies the investment. A high-volume channel with low conversion is less valuable than a low-volume one that closes reliably.
How do I measure marketing-sourced vs. marketing-influenced ARR?
Marketing-sourced ARR counts only deals where marketing created the initial opportunity (first touch). Marketing-influenced ARR includes any deal where marketing had a touchpoint. For prioritization, weight sourced ARR much more heavily. Influenced ARR inflates every channel's contribution, making it impossible to differentiate. Use self-reported attribution ("How did you hear about us?") to validate your model's sourced data.
What is a good marketing efficiency ratio benchmark for SaaS companies?
A Marketing Efficiency Ratio (MER)—total revenue divided by total marketing spend—above 5x is generally considered strong for B2B SaaS. Companies with an MER below 3x should investigate whether spend is concentrated in channels with poor ARR contribution. Use MER as a portfolio-level health check, not a channel-level prioritization signal.
How do I account for dark funnel activity when prioritizing marketing investments?
Add a mandatory, open-text self-reported attribution field to your demo or signup form asking, "How did you first hear about us?" This captures channels that attribution models miss, like podcasts, word of mouth, and community mentions. Use this data as a weighting adjustment on your prioritization scorecard. If 30% of deals self-report a channel your model credits with 5%, that channel is undervalued.
What role does expansion revenue play in marketing prioritization for ARR?
Expansion ARR from upsells and cross-sells often has 3-5x better unit economics than net-new ARR. If your net revenue retention is below 110%, marketing should allocate dedicated effort to expansion activities like product adoption content and upgrade campaigns. It's best to prioritize expansion activities separately from net-new activities using a parallel scorecard, as the inputs and economics are fundamentally different.
How should early-stage SaaS companies prioritize marketing differently than growth-stage for ARR?
Early-stage companies ($1M-$5M ARR) should prioritize demand capture channels (paid search, review sites) to convert existing intent and prove unit economics quickly. Growth-stage companies ($10M+ ARR) must shift investment toward demand generation (content, brand, events) because capture channels inevitably hit diminishing returns at scale. The signal to make this shift is when your "magic number" drops below 0.7 for two straight quarters.