Martech Stack Optimization: The Three-Layer Model Most Teams Miss

TL;DR
- Standard martech stack optimization—tool consolidation and data hygiene—is necessary but insufficient. It cleans up the stack without making it faster.
- The real performance constraint is latency: the time between an insight surfacing and a change going live. This is what you should optimize for.
- Use a three-layer model to target latency: optimize the flow of data between tools, the speed of decisions based on that data, and the handoffs required for execution.
- Calculate your "Stack Latency Score" by measuring the average hours from insight to shipped change across your five most common marketing actions.
- If your score is over 72 hours, your system is too slow. The goal is to get the full cycle under 48 hours.
The average martech utilization rate has plummeted. Teams are paying for more tools than ever but using less of each one, with Gartner reporting a drop from 58% utilization in 2020 to just 33% today. The standard advice for martech stack optimization is a familiar refrain: consolidate redundant tools, clean up your customer data, and automate a few workflows.
This advice is correct, but it's dangerously incomplete.
Most optimization efforts target how well individual tools perform in isolation. You clean up a dashboard, you merge two contracts, you fix a broken integration. The result is a cheaper, tidier stack that still ships changes at the same glacial pace. The real performance constraint isn't the quality of your tools; it's the latency of the system that connects them—the time it takes to move from surfacing an insight to shipping a change.
This article will first cover the foundational optimizations that earn the ranking: tool consolidation, data hygiene, and better utilization. But then we'll introduce a three-layer model that targets the actual bottleneck: latency. By the end, you'll have a measurable diagnostic—the Stack Latency Score—that will change how you think about your stack's performance forever.
Start with the Fundamentals: Consolidation, Utilization, and Integration
These three areas are the table stakes of martech optimization. They are necessary housekeeping that reduces cost and complexity, but they are not the end goal. Most guides stop here. We see this as the foundation that earns you the right to focus on what truly matters: speed.
Audit for Redundancy and Shelfware Before Adding Anything New
The first move in any martech stack optimization is always subtraction. As is now widely recognized, the average B2B organization runs 12-20 marketing technology tools, creating significant capability overlap and what's known as "shelfware"—software that is paid for but rarely used.
Start by building a capability overlap matrix. Create a simple spreadsheet listing every tool in your stack. Map its core functions, monthly cost, and the number of active users in the last 90 days. You'll quickly spot the redundancies, like paying for both Clearbit and ZoomInfo for enrichment, or the "seat bloat" from licenses assigned to team members who logged in once during onboarding and never returned.
Your immediate action is to flag any tool with fewer than three active users or more than 50% feature overlap with another platform in your stack. This isn't about cutting tools for the sake of it; it's about eliminating the financial and cognitive drag of a bloated portfolio.
Close the Feature Adoption Gap in Your Existing Tools
Most teams are paying for enterprise-tier platforms while using only starter-tier functionality. Think of a team using HubSpot for basic email sends and contact storage but ignoring its powerful workflow automation, lead scoring, and attribution reporting—only to then go out and buy separate point solutions for each of those functions.
This is a failure of adoption, not tooling. Your martech utilization rate is a critical diagnostic. For each core platform, list the top ten features you're paying for versus the features anyone on your team has actually used in the last 90 days. If that gap is over 50%, you have an adoption problem. Tool utilization audits often overstate this by measuring every single feature, but even focusing on the critical path reveals that optimization often means going deeper into existing tools, not wider into new ones.
Fix the Data Plumbing: Hygiene, Integration, and Workflow Automation
With a leaner toolset, the next layer of foundational optimization is ensuring data can move cleanly between them. You can't optimize decisions if the data feeding those decisions is stale, duplicated, or siloed in a platform nobody checks.
The classic failure mode is a team where lead scoring in HubSpot doesn't reflect product usage data from Mixpanel because the integration was set up once, broke silently during a platform update, and nobody noticed for a quarter. This is the "data silo tax," and every team pays it until they fix the plumbing.
Establish a Single Source of Truth for Customer Data
The most common data problem isn't just dirty data; it's conflicting data. A lead's status in Salesforce doesn't match their engagement score in the marketing automation platform, which doesn't match their behavioral profile in the product analytics tool. When your systems disagree on reality, your team wastes time just figuring out which number to trust.
The architectural solution is to establish a Single Source of Truth (SSoT). This doesn't mean picking one tool to do everything. It means designating one system—often a Customer Data Platform (CDP) like Segment, or a data warehouse like Snowflake fed by reverse ETL tools like Hightouch or Census—as the canonical record. All other tools sync from this central hub, ensuring consistency.
Automate the Handoffs That Nobody Thinks About
The biggest integration wins aren't always the obvious ones, like a CRM-to-MAP sync. They are the small, manual data movements that eat 30 minutes at a time but happen 20 times a week across the team.
I'm talking about the marketer who manually exports a CSV from Google Analytics, reformats it, and uploads it to a reporting dashboard every Monday morning. This is a workflow that could be fully automated with a tool like Fivetran or a simple Workato recipe. Many teams suffer from "webhook sprawl," a tangled mess of point-to-point integrations where no one is sure what triggers what. The most useful integration audit you can run is to simply ask your team: "What data did you have to manually copy and paste this week?" The answers will reveal your true automation priorities.
But Most Optimization Advice Stops at Making Individual Tools Work Better
Everything above is correct. And if you stop there, you'll have a cleaner, cheaper stack that still ships changes at the same glacial pace.
Conventional martech stack optimization treats the stack as a collection of individual tools to be tuned—better dashboards, cleaner data, fewer redundant licenses. But a martech stack is not a collection of tools. It's a system, and systems have a different performance constraint than their individual components.
The constraint is latency: the time between an insight surfacing somewhere in the stack and a change going live on the website, in an ad, or in an email. When the gap between identifying a conversion opportunity and shipping the fix stretches into weeks, that latency directly inflates customer acquisition cost. This is precisely why platforms like Spike AI, which continuously ship optimization changes without human queue time, represent a structural cost advantage.
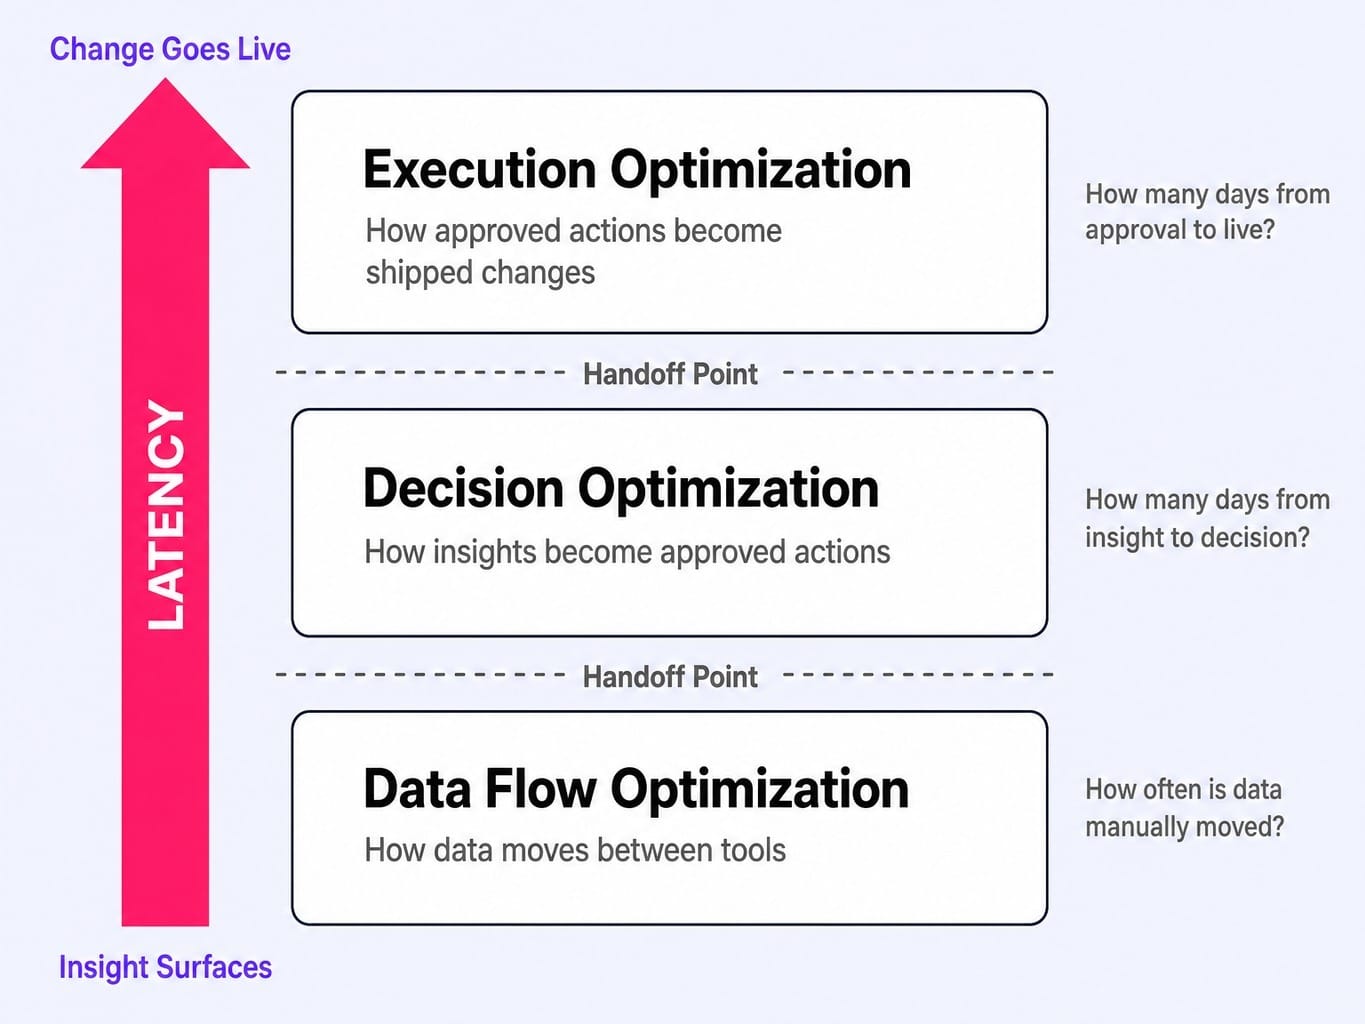
To truly optimize your stack, you must stop tuning the tools and start optimizing the system's speed. This requires a three-layer model that targets latency directly:
- Data Flow Optimization: How data moves between tools.
- Decision Optimization: How insights become approved actions.
- Execution Optimization: How approved actions become shipped changes.
Layer 1: Data Flow Optimization — Eliminate the Copy-Paste Tax
Diagnostic Question: How many times per week does someone on your team manually move data from one tool to another?
Most teams dramatically underestimate this number because the movements are small and habitual—exporting a report here, copy-pasting a metric there. Each one is a "copy-paste tax" that adds latency and introduces the risk of human error.
I once ran a time-motion audit on a B2B SaaS marketing team and found they were spending eleven hours per week just copying data between their SEO crawler, their project management tool, and their CMS before any optimization work could even begin. The tax was invisible because it was distributed across five people in small increments.
Consider a growth marketer who spends 45 minutes every morning pulling data from Google Search Console, cross-referencing it with HubSpot engagement data, and updating a shared Google Sheet that the content team uses to prioritize blog updates. That's 3.75 hours per week. At a fully loaded cost of $75/hour, that one manual workflow costs the business over $14,000 a year.
The optimization is to map every point where data sits waiting for a human to move it, then automate the handoff. Use reverse ETL tools (Hightouch, Census), an iPaaS layer (Workato, Tray.io), or warehouse-native orchestration to eliminate this "activation latency."
Benchmark: Best-in-class teams have zero manual data movements in their core marketing workflows. Most teams have 5-15 per week.
Layer 2: Decision Optimization — Shrink the Gap Between Insight and Approval
Diagnostic Question: When your SEO tool flags a priority fix, how many days until someone decides to act on it?
Most martech stacks are brilliant at surfacing insights. They generate alerts, populate dashboards, and send reports. But there is no system for converting those insights into decisions. The path from "this data says we should do X" to "we have decided to do X" runs through a swamp of Slack threads, weekly status meetings, and manager approvals.
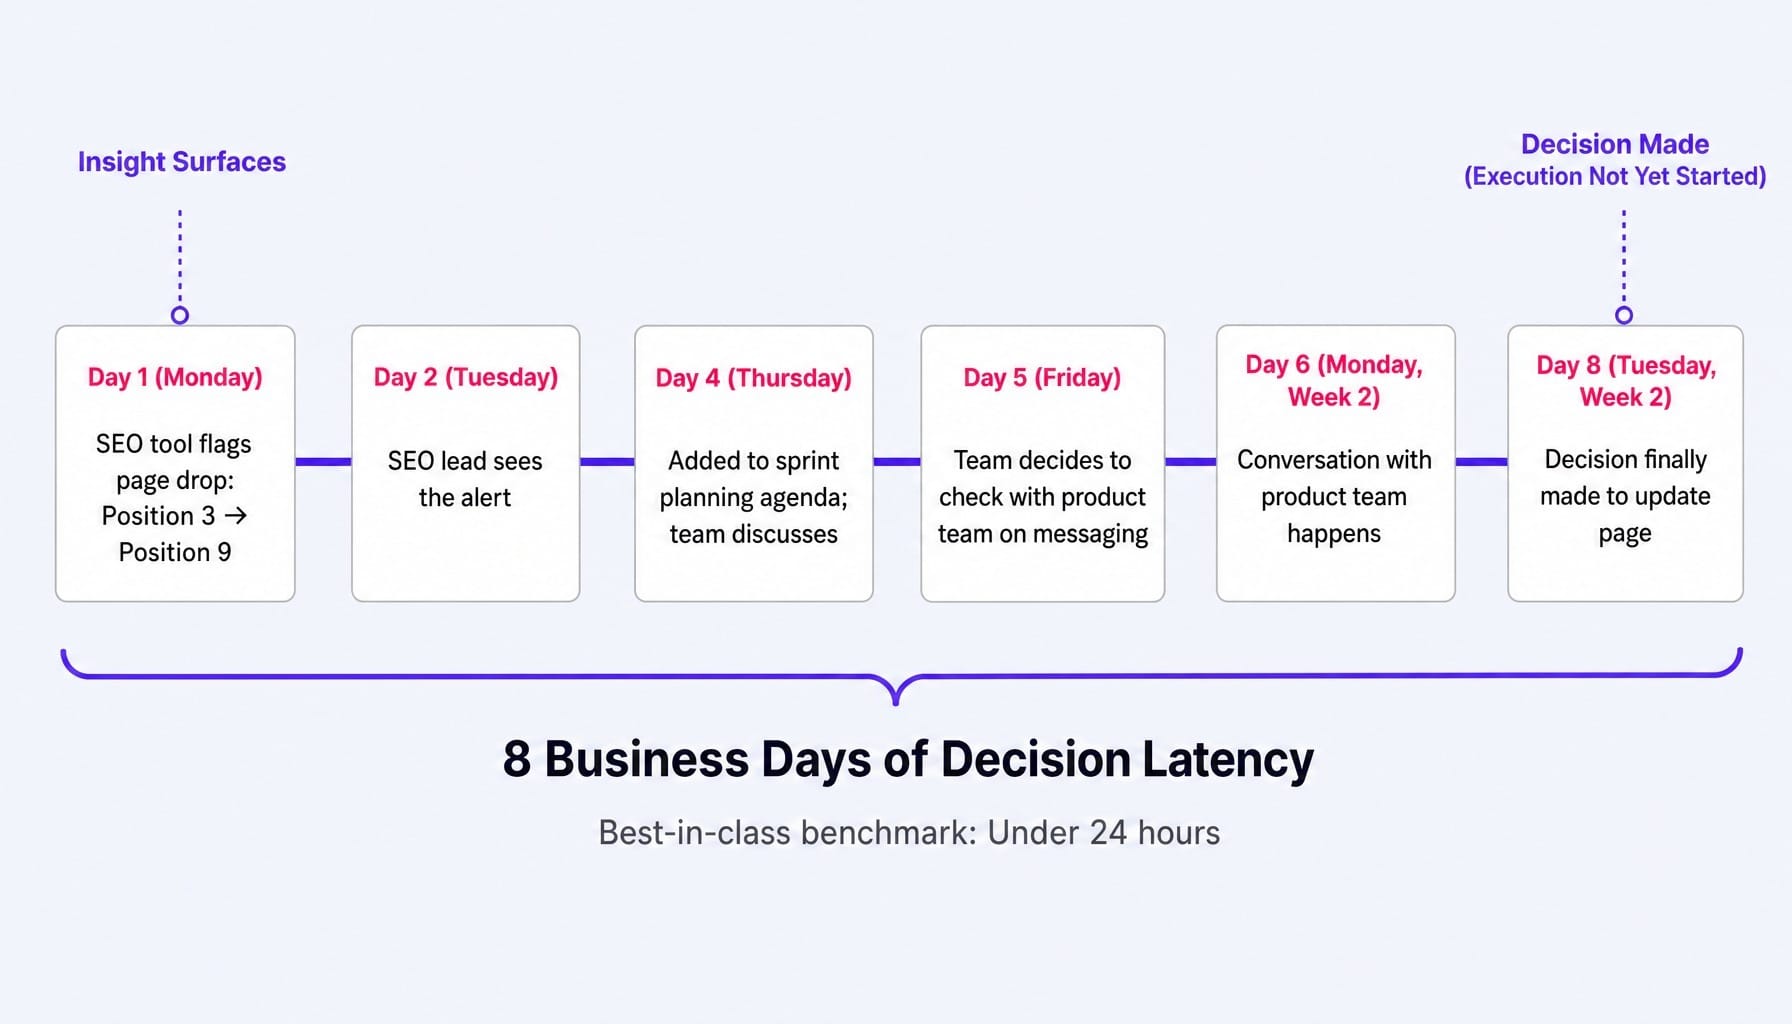
Imagine your SEO platform flags that a high-traffic page has dropped from position 3 to position 9 due to a content freshness issue. The alert fires on Monday. The SEO lead sees it Tuesday and adds it to the agenda for Thursday's sprint planning meeting. The team discusses it but decides they need to check with the product team on messaging. That conversation happens the following Monday. The decision to finally update the page is made on Tuesday—eight business days after the insight surfaced.
As most SEO practitioners will tell you, a drop from position 3 to 9 can mean losing over 80% of a page's organic clicks. Two weeks of decision latency is not a trivial delay; it's a direct loss of pipeline.
Benchmark: Best-in-class teams make decisions on surfaced insights within 24 hours. Most teams take 5-10 business days. The optimization is structural: designate clear decision-owners for each type of action and create pre-approved playbooks for common scenarios so routine fixes don't require a meeting.
Read more: SaaS Marketing Metrics That Actually Inform Decisions (Not Just Dashboards) | Spike AI
Layer 3: Execution Optimization — Ship the Change, Not Just the Decision
Diagnostic Question: After a change is approved, how many days until it is live?
This is the layer most martech stack optimizations completely ignore because it's rarely a tool problem. It's a workflow and handoff problem. The decision is made, but now it needs to be executed.
A brief goes to a designer with a 3-day queue. A mockup goes to a developer with a 5-day sprint cycle. A piece of copy goes to legal for a 2-day review. Each handoff adds days of latency.
Let's follow that landing page update. The team approves a new headline and CTA. The marketing manager writes a brief. The designer gets to it three days later. After a round of revisions (another day), the final version goes to a developer for implementation. It enters their queue and goes live 11 business days after it was approved. The total time from insight to live change is now approaching a full month.
This is the gap that matters. A team shipping one meaningful change every two weeks makes ~26 changes a year. A team that can shrink that cycle can ship 3-4x that volume, and the compounding gains are enormous.
Benchmark: Best-in-class teams complete the full cycle—insight surfaced → decision made → change live—in under 48 hours. Most teams take 2-4 weeks. This gap is what your martech stack optimization should actually target. Not dashboard configuration. Not tool selection. The speed at which your entire system converts intelligence into shipped changes.
Calculate Your Stack Latency Score
Optimization without measurement is just reorganization. To make this tangible, you need a single number that captures how fast your marketing system ships changes: the Stack Latency Score.
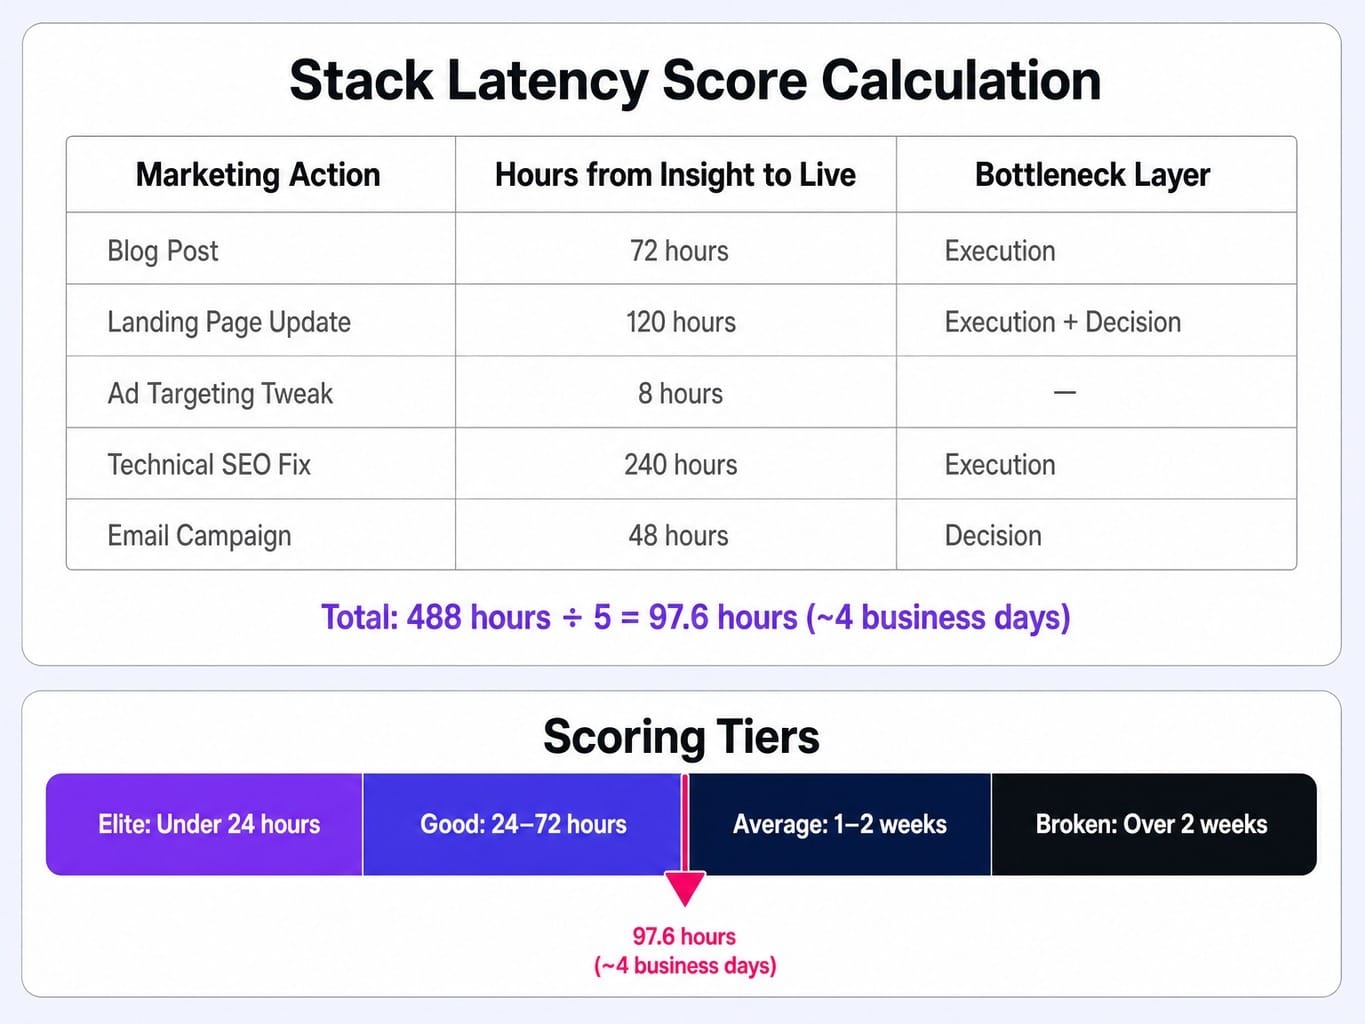
Here's how to calculate it. Pick your five most frequent marketing actions. For each one, measure the total hours from when the insight or request first surfaces to when the change is live in production.
Example Actions:
- Publishing a new blog post.
- Updating a landing page based on performance data.
- Adjusting ad campaign targeting or creative.
- Fixing a technical SEO issue flagged by a tool.
- Launching a new email nurture campaign.
Sum the total hours for all five actions, then divide by five. That's your Stack Latency Score.
Scoring Tiers:
- Under 24 hours (Elite): Your stack is a shipping engine.
- 24-72 hours (Good): You have some manageable latency.
- 1-2 weeks (Average): Your stack is functional but slow. You are leaving compounding gains on the table.
- Over 2 weeks (Broken): Your stack is working against you. The tools may be great, but the system is broken.
Worked Example:
Imagine your team's times are:
- Blog Post: 72 hours (from topic approval to published)
- Landing Page Update: 120 hours (from data insight to live change)
- Ad Targeting Tweak: 8 hours
- Technical SEO Fix: 240 hours (from tool flag to deployed fix)
- Email Campaign: 48 hours (from brief to sent)
Total: 488 hours / 5 = 97.6 hours (approx. 4 business days).
This score is borderline average/good. But it immediately reveals the bottlenecks: technical SEO fixes and landing page updates. Those are the two workflows to optimize first. This score becomes the KPI that replaces vague assessments of "stack health." It's measurable, trackable, and directly tied to your team's ability to impact the business.
What If Your Stack Latency Score Could Drop to Under 48 Hours?
The three-layer model reveals an uncomfortable truth: your stack isn't slow because of bad tools. It's slow because of the human-dependent handoffs between insight, decision, and execution. The Stack Latency Score proves it.
This is the exact tension Spike AI is built to resolve. It isn't another tool to add to your stack; it's the layer that collapses the latency.
Spike AI's platform handles the data flow, continuously identifying the highest-impact move across your website, SEO, and ads (Layer 1). It then prioritizes and recommends the action, turning a multi-day approval cycle into a single review (Layer 2). Finally, it ships the change without requiring engineering tickets or designer queues (Layer 3).
The result is a weekly shipping cadence where insights become live changes in days, not weeks. This is the difference between optimizing your stack's tools and optimizing your stack's speed. Spike AI is designed from the ground up to drive your Stack Latency Score below 48 hours, turning your marketing function from a series of manual workflows into a cohesive, high-speed shipping system.
See how Spike AI compresses your insight-to-shipped cycle to under 48 hours
Conclusion
Martech stack optimization is not about making individual tools perform better. It's about reducing the total system latency between an insight surfacing and a change going live.
The fundamentals of tool consolidation, data hygiene, and utilization are necessary starting points, but they are insufficient. The real work is applying the three-layer model: optimizing the flow of data, the speed of your decisions, and the efficiency of your execution. The Stack Latency Score gives you a concrete, measurable KPI to track your progress.
Calculate your score this week. If it's over 72 hours, your stack isn't underperforming because of bad tools—it's underperforming because the system connecting those tools is too slow. The optimization that matters most isn't the one that makes your dashboard prettier. It's the one that gets meaningful changes shipped faster.
Frequently Asked Questions
What is the difference between martech rationalization and martech optimization?
Rationalization is a subset of optimization focused on reducing the number of tools—cutting redundancy, eliminating shelfware, and consolidating vendors. Optimization is broader. It includes rationalization but also covers improving data flows, decision speed, and execution latency. You can rationalize your stack (fewer tools) and still have a slow, latency-heavy system.
How often should we re-evaluate our martech stack?
Run a full tool audit annually, but track your Stack Latency Score monthly. The annual audit catches tool-level issues like redundancy and contract renewals. The monthly latency score catches system-level degradation—workflows that have silently slowed down because a new approval step was added or an integration broke without anyone noticing.
Should I consolidate onto a single vendor ecosystem or maintain a best-of-breed stack?
Neither is universally correct. Single-vendor ecosystems (e.g., HubSpot) reduce integration complexity but create lock-in. Best-of-breed stacks offer superior individual capabilities but multiply handoff points and integration costs. The deciding factor should be your Stack Latency Score: if a best-of-breed approach adds days of latency through integration gaps, the theoretical feature advantage isn't worth it.
How do I get executive buy-in for a martech consolidation initiative?
Executives respond to cost and speed. Calculate the total cost of ownership for your stack (licenses + maintenance + internal time) and your Stack Latency Score. Present both numbers together: "We spend $X/year on martech, and it currently takes us Y days to ship a change." That framing makes the business case self-evident.
How do I handle change management when sunsetting a tool teams rely on?
The biggest risk isn't losing features; it's breaking the informal workflows people built around the tool. Before sunsetting, document every workflow that touches the tool, not just its official use case. Announce the plan 60 days out, migrate the workflows in parallel, and don't kill access until the replacement processes are confirmed to be working.
How do AI-native tools change martech stack architecture decisions in 2026?
AI-native tools collapse multiple stack layers into one. A traditional stack might need separate tools for data analysis, insight generation, and execution. An AI-native platform can handle several of those layers internally, reducing integration points and latency. The new litmus test for any tool addition: does it reduce your Stack Latency Score, or add another handoff point?