
B2B SaaS Marketing Budget Breakdown: What the Benchmarks Don't Tell You

TLDR
- B2B SaaS marketing benchmarks (median ~8% of ARR) are misleading without normalizing for your ACV and sales cycle length. A $15K ACV product and a $120K ACV product require entirely different budget architectures.
- Your budget is a function of unit economics. If your LTV:CAC ratio is below 3:1 or your CAC payback period exceeds 18 months, you have an efficiency problem, not a budget problem.
- Stop treating your budget as an annual plan. Use leading indicators like pipeline velocity decay by channel to trigger mid-quarter reallocations, shifting spend away from underperforming channels weeks before it shows up in revenue reports.
- The headcount-to-program spend ratio is shifting. Historically 50/50, AI-assisted execution allows a move toward 35/65, freeing up budget from salaries and agency retainers to be spent on programs that generate pipeline.
- Most teams are losing 15-25% of their marketing budget to tooling bloat—a stack of software that diagnoses problems but doesn't execute solutions, leaving the execution gap entirely on your plate.
A Series B SaaS company allocates 15% of its ARR to marketing, landing squarely in the recommended range of every benchmark report. The board is satisfied. Yet, pipeline coverage sits at 2.5x against a 3.5x target, and the marketing team can't coherently explain which dollars are producing pipeline and which are just producing dashboards.
This isn't a hypothetical. This is the state of most B2B SaaS marketing.
The problem with guidance on building a B2B SaaS marketing budget is that it treats budgeting as an allocation exercise—what percentage to spend, which channels to fund. It's a spreadsheet problem. But budgets don't fail in the spreadsheet. They fail at the execution layer. The real constraint isn't capital; it's the throughput of converting budget into shipped changes that demonstrably moves the pipeline.
This article will cover the benchmarks, because they're a necessary starting point. But we won't stop there. We will dissect the unit economics that govern your spending, the structural splits that define your go-to-market motion, and the reallocation triggers that determine whether your budget produces revenue or just reports.
What B2B SaaS Companies Actually Spend on Marketing in 2026
Let's get the headline numbers out of the way. According to SaaS Capital's 2025 survey of over 700 private B2B SaaS companies, the median marketing spend is approximately 8% of ARR. This is a notable dip from the ~10% seen in prior years, a clear signal of the market's intense pressure for efficient growth. Corroborating this, Gartner reports a 7.7% average, with Forrester at a similar 8%.
But the median is a trap. The useful data lies in the segmentation by growth stage:
- Early-Stage (pre-$5M ARR): Spend is aggressive, typically 20-40% of revenue, focused on finding product-market fit and establishing initial traction.
- Scaling Companies ($5M-$20M ARR): Spend normalizes to 10-20% as companies scale proven channels.
- Mature Companies ($20M+ ARR): Efficiency becomes paramount, with spend tightening to 5-12%.
Here's the part most reports omit: these benchmarks are dangerously misleading because they don't normalize for Annual Contract Value (ACV) and sales cycle length. A company selling a $15K ACV product with a 90-day sales cycle requires a fundamentally different marketing system than one selling a $120K ACV product with a 9-month cycle. The first needs a volume-driven demand generation engine. The second needs a high-touch, account-based precision machine.
Applying the same 10% of ARR to both is functionally meaningless. One budget is built for demand capture at scale; the other is built for demand creation in a small, defined market. Benchmarks are a calibration tool, not a strategy. The rest of this article covers what actually determines if the budget works.
The Unit Economics That Should Drive Your Budget
Your saas marketing budget isn't a percentage of revenue. It's a direct function of three core unit economics: what it costs to acquire a customer (CAC), how much that customer is worth over their lifetime (LTV), and how quickly you get your money back (CAC payback period). Budgeting without these numbers is just sophisticated guessing.
Recent data from Benchmarkit and Forth & Scale shows the new customer CAC ratio has climbed to $2.00 (up 14% YoY), while median CAC payback now sits at 18 months, up from 14. This means it's getting more expensive and taking longer to earn back acquisition costs. If your budget isn't grounded in these realities, it's already broken.
CAC, LTV, and the Ratio That Tells You If Your Budget Is Working
The LTV:CAC ratio is the single most important number for determining whether your marketing budget is sized correctly. A ratio below 3:1 indicates you're spending more to acquire customers than they're worth at current retention rates. A ratio above 5:1 often means you're underinvesting and leaving growth on the table.
Let's make this concrete. Imagine your product is $500/month with an 80% gross margin and 5% monthly churn. Your LTV is $8,000. To maintain a healthy 3:1 LTV:CAC ratio, your maximum allowable CAC is $2,667. If your blended CAC is currently $3,200, you don't have a budget problem—you have a conversion efficiency problem that no amount of additional spend will fix.
Median LTV:CAC for B2B SaaS hovers between 3.2:1 and 3.6:1. Before you debate spending 10% or 15% of ARR, calculate this ratio. It tells you whether you can afford to spend more or need to fix your execution engine first.
Why Net Revenue Retention Should Change How Aggressively You Budget for Acquisition
Net Revenue Retention (NRR) is the most overlooked input for marketing budget decisions. Most marketers treat it as a Customer Success metric, which is a critical mistake. Your NRR directly dictates your acquisition budget ceiling.
If your NRR is above 110%—meaning the average customer becomes more valuable over time through expansion—you can afford a higher CAC and should budget more aggressively for new customer acquisition. Every cohort you acquire is an appreciating asset. If your NRR is below 100%, you're pouring water into a leaking bucket. Increasing acquisition spend simply amplifies the rate of loss.
Consider the benchmarks: enterprise SaaS NRR is around 118%, while SMB SaaS is closer to 97%. This is why two companies with identical ARR and growth rates might rationally set marketing budgets that are 2x apart. One is fueling a compounding growth engine; the other is just trying to stay afloat. Your retention economics determine your acquisition budget.
How to Split Your Budget: PLG vs. Sales-Led and People vs. Programs
"Channel allocation" advice is useless without first understanding your go-to-market motion. A product-led growth (PLG) company and a traditional sales-led company at the same ARR should have fundamentally different budget architectures, yet most benchmark reports average them together into a meaningless blend. The first decision isn't about channels; it's about structure.
PLG-Dominant vs. Sales-Led: Why the Same Budget Needs Different Architecture
A PLG-dominant company's budget should be weighted toward activities that let the product do the selling: product experience, self-serve content, onboarding optimization, and in-app conversion loops. The goal is to reduce CAC by automating the sales process.
A sales-led company's budget must be weighted toward feeding and accelerating a human sales process: demand generation, Account-Based Marketing (ABM), sales enablement, and pipeline acceleration events.
Here's what that looks like in practice:
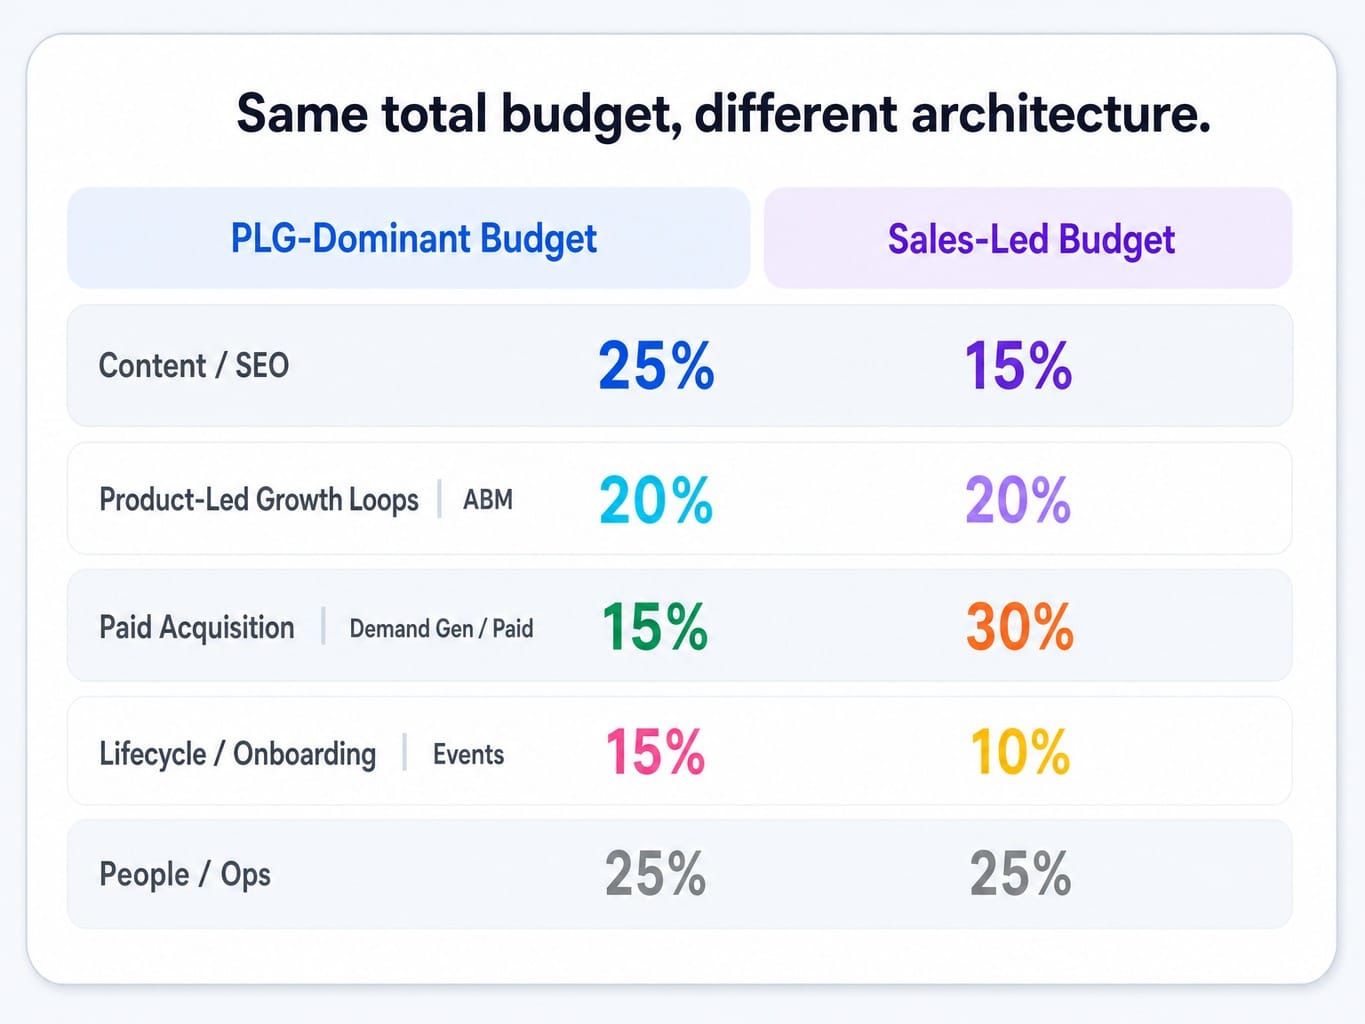
- PLG Budget Example: 25% to content/SEO, 20% to product-led growth loops, 15% to paid acquisition, 15% to lifecycle/onboarding, 25% to people/ops.
- Sales-Led Budget Example: 30% to demand gen/paid, 20% to ABM, 15% to content, 10% to events, 25% to people/ops.
The total budget might be the same, but the internal architecture is completely different. Your GTM motion is the first and most important filter for any budget decision.
The Headcount-to-Program Ratio Is Shifting—And Most Teams Haven't Adjusted
Historically, the split has been simple: 45-55% of a saas marketing budget goes to people (salaries, contractors, agencies), leaving the rest for actual programs (ads, tools, content). This ratio is a relic of a system constrained by human bandwidth.
AI-driven content and campaign automation is compressing this ratio. Teams embedding AI into their production workflows are shifting toward a 35-45% people / 55-65% program spend. They are getting more execution throughput without proportional headcount growth.
Most teams, however, are stuck. They're still running manual workflows that require human intervention at every step. Consider a three-person marketing team with a $220k annual budget. A 55% people cost (salaries, agency) leaves just over $8k/month for actual programs. The same team using AI-assisted execution could reduce agency dependency, freeing up an extra $3k/month to invest directly into programs that generate pipeline. Your people-to-program ratio reflects your operational maturity—are you constrained by 2022 workflows or enabled by 2026 systems?
Read more: How to Prioritize Marketing Channels With a Limited Budget And Resources (Framework for Lean Teams)
The Hidden Budget Layer: Marketing Ops and Tooling Bloat
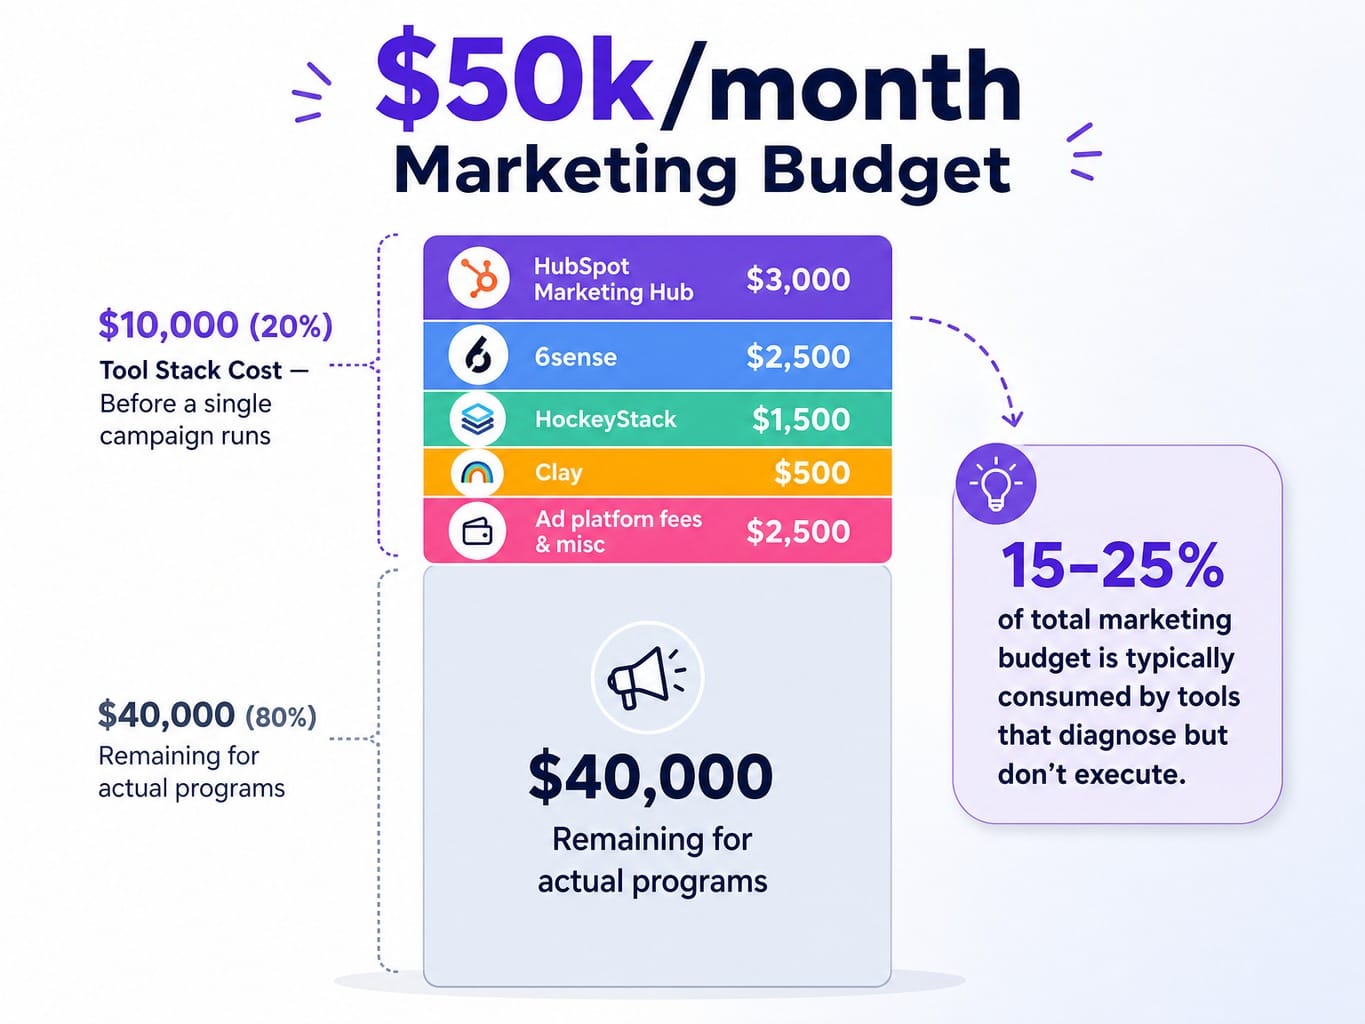
Most budget templates have a line for "Tools." That line is quietly consuming your ability to execute. A typical scaling SaaS company now spends 15-25% of its total marketing budget on its marketing operations tool stack. That's a stunning figure, especially when you consider what those tools actually do.
Between your marketing automation platform (HubSpot, Marketo), attribution platform (Factors.ai, Dreamdata), ABM suite (6sense, Demandbase), intent data, and enrichment tools (Clay), you are paying for an army of dashboards. These tools are exceptionally good at identifying problems, surfacing insights, and generating recommendations. They are exceptionally bad at implementing solutions.
Let's make it real. On a $50k/month marketing budget, a $10k tool stack isn't uncommon:
- HubSpot Marketing Hub: $3,000
- 6sense: $2,500
- HockeyStack: $1,500
- Clay: $500
- Ad platform fees & misc: $2,500
That's 20% of your budget gone before you've run a single campaign, all to produce reports that still require human bandwidth to interpret and act upon. This isn't a procurement problem; it's a symptom of a fragmented execution system. The gap between what your tools identify and what actually gets shipped is entirely on your plate.
Read more: Stop Syncing Strategy and Execution: Platforms That Unify Marketing Goals With Task Management
When and How to Reallocate Budget Mid-Quarter
SaaS companies treat marketing budgets as annual plans reviewed quarterly. This means they operate on 90-day feedback loops in a market that shifts weekly. By the time your QBR reveals a channel is underperforming, you've already wasted 8-12 weeks of spend.
The alternative is to track leading indicators. The most powerful is pipeline velocity decay. Don't just track how much pipeline a channel produces; track how fast that pipeline moves through stages. When deals from a channel start taking longer to progress or stage-to-stage conversion rates drop, that's a signal the channel's effectiveness is declining—weeks before it shows up in top-line volume or revenue.
Imagine your team notices that MQL-to-SQL conversion from LinkedIn ads has dropped from 18% to 11% over six weeks, while Google Ads MQL-to-SQL has held steady at 22%. Your LinkedIn pipeline volume hasn't dropped yet—because you increased spend to compensate—but the velocity has decayed. This is the signal. This is when you prioritize marketing channels and reallocate 20-30% of that LinkedIn budget to Google Ads, before the volume decline materializes.
Here are three practical reallocation triggers to monitor:
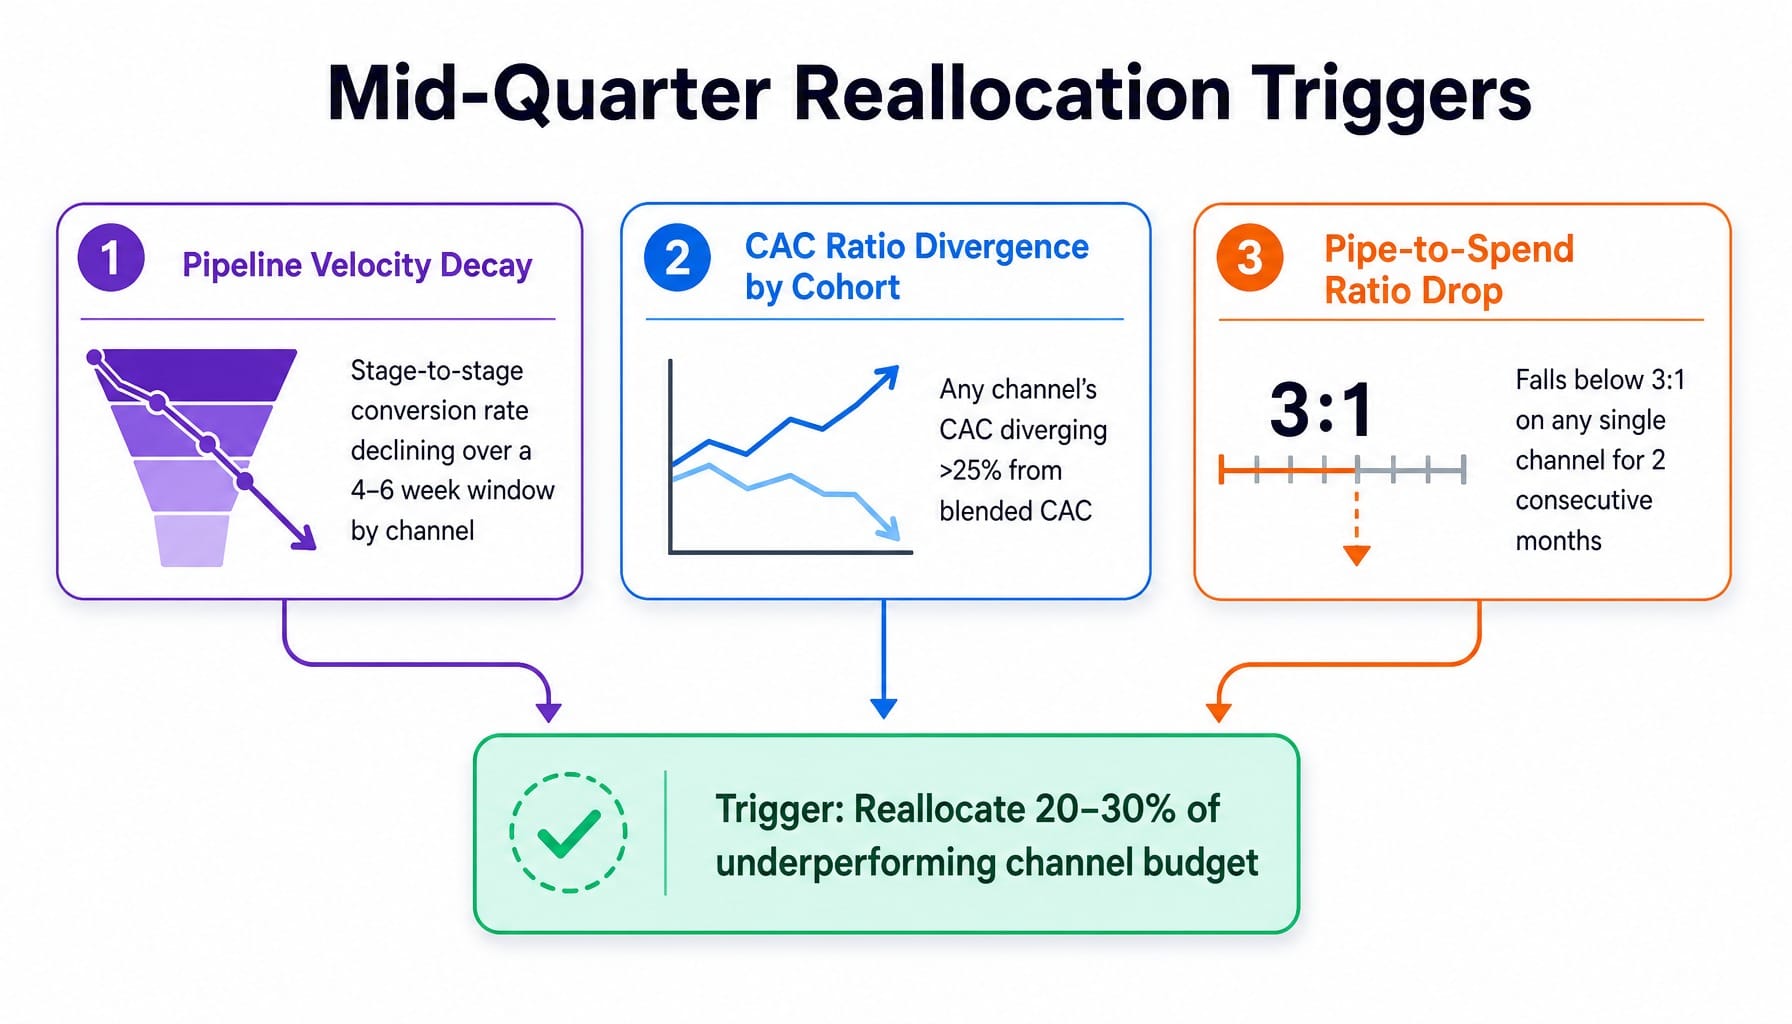
- Pipeline velocity decay by channel over a 4-6 week window.
- CAC ratio by cohort diverging more than 25% from your blended CAC.
- Pipe-to-spend ratio falling below 3:1 on any single channel for two consecutive months.
Budget agility isn't about having more meetings. It's about having the right system to detect decay and reallocate within weeks, not quarters.
Closing the Gap Between Budget and Execution
We've established a clear tension. You know what to spend, and you have frameworks for allocation. But your budget's ROI is being silently eroded by two forces: tooling bloat that diagnoses but doesn't act, and slow reallocation cycles that waste spend on decaying channels. The real budget leak is execution latency—the weeks or months between identifying what needs to change and actually shipping that change.
This is precisely the gap Spike AI is built to close. Where traditional tools stop at dashboards and hand you homework, Spike AI functions as an execution layer. It doesn't just identify the highest-impact move across your website, SEO, and ads; it deploys the fix. Weekly.
This directly addresses the core constraints discussed. It compresses the headcount-to-program ratio by automating execution that once required specialists or agencies. It solves the tooling bloat problem by replacing five diagnostic tools with a single system that diagnoses and deploys. It delivers the output of an elite agency at a fraction of the coordination cost, turning your backlog into a weekly release cadence. If budget effectiveness is constrained by execution throughput, the solution isn't more budget—it's more execution capacity per dollar spent.
See how Spike AI turns your marketing budget into shipped results — weekly.
Conclusion
Your B2B SaaS marketing budget is not a spreadsheet. It's an execution system. The percentage of ARR is merely the input. The output—pipeline and revenue—is determined by how tightly that system connects to unit economics, how honestly it accounts for operational costs, and how quickly it can self-correct.
Benchmarks calibrate. Unit economics constrain. Structural splits operationalize. But it is execution velocity that determines whether any of it compounds. The teams that win in 2026 won't be the ones with the biggest budgets. They will be the ones that ship the most meaningful changes per dollar spent.
Frequently Asked Questions
How should a pre-revenue SaaS startup allocate its marketing budget before product-market fit?
Before PMF, your marketing budget is for learning, not scaling. Allocate 70-80% to customer development, positioning research, and small-scale channel experiments to validate messaging and your ICP. Total spend should be minimal ($3k-$8k/month) until you have repeatable evidence of conversion from at least one channel. Don't fund demand gen programs that scale unvalidated assumptions.
What is the difference between blended CAC and paid CAC, and which should drive budget decisions?
Blended CAC includes all marketing and sales costs divided by all new customers (organic, referral, etc.). Paid CAC isolates only customers acquired via paid channels against paid spend. You need both. Blended CAC tracks overall business efficiency. Paid CAC tracks the marginal cost of growth, which is what you're actually deciding when you increase or decrease ad spend.
Should a SaaS company cut marketing spend to improve its Rule of 40 score?
This is a dangerous short-term move that often destroys long-term pipeline. If your growth rate drops faster than your profit margin improves, the Rule of 40 score actually worsens. A better approach is improving marketing efficiency—reducing your CAC payback period and increasing your pipe-to-spend ratio—so the same budget produces more growth. Cut waste, not strategic investment.
How do you justify a marketing budget increase to a SaaS board of directors?
Boards respond to unit economics, not channel plans. Frame your request using three numbers: your current LTV:CAC ratio (proving efficiency), your CAC payback period (proving capital recovery speed), and the projected pipeline coverage at the proposed budget versus the current one. Show them how incremental spend will increase pipeline coverage from 2.5x to a healthier 3.5x while maintaining or improving your core efficiency ratios.
How should marketing budget allocation change after a SaaS company raises a Series B?
Post-Series B, the mandate shifts from proving channels to scaling what's proven. Budget typically increases to 15-25% of ARR. The common mistake is dumping it all into paid acquisition because it's fast. A more robust pattern is allocating 40-50% to scaling proven channels, 20-25% to building owned distribution (content, community, product-led loops), and reserving 15-20% for new channel experimentation with clear kill criteria.