How to Calculate the SaaS Magic Number (And Why the Blended Number Lies)
TLDR
- The standard SaaS Magic Number is (Current Quarter Revenue − Previous Quarter Revenue) × 4 ÷ Previous Quarter S&M Spend. A value over 0.75 is considered efficient, but this is misleading without context.
- Decompose the metric by revenue type. A blended magic number often hides inefficient new-logo acquisition behind highly efficient expansion revenue, leading to poor capital allocation.
- For companies with sales cycles over 90 days, the quarterly magic number is unreliable due to the lag between S&M spend and revenue recognition. Use a trailing-twelve-month calculation instead.
- Investors increasingly expect the Gross Margin Adjusted Magic Number (Standard Magic Number × Gross Margin %) as it reflects true capital efficiency by accounting for the cost of revenue.
- While the Magic Number is a quick pulse check, CAC Payback Period is a more precise operational metric for diagnosing unit economics at the cohort and channel level.
A Series B SaaS company calculates its magic number. The result is 0.85. The board deck is prepped, the team celebrates hitting an "efficient" growth milestone, and the CFO gets the green light to double sales and marketing spend next quarter.
Six months later, pipeline has stalled and the new-logo count is flat. What happened?
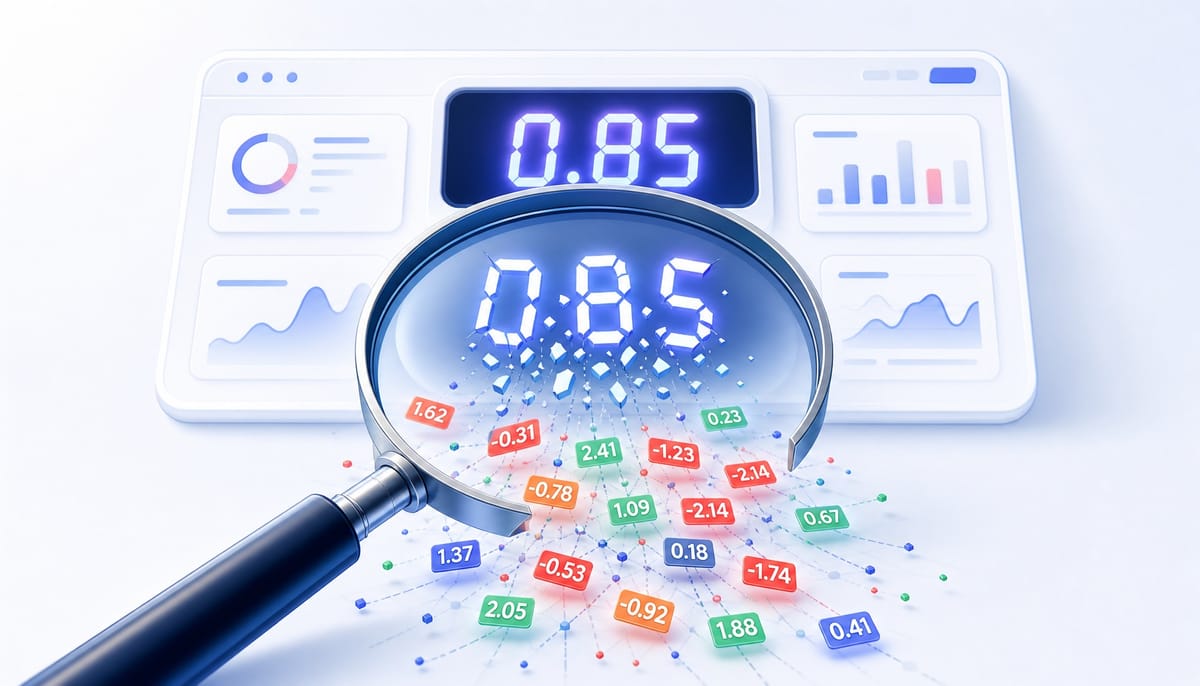
Nearly all the ARR growth that produced the "efficient" 0.85 came from two major expansion deals within existing accounts. The new-logo acquisition engine was actually burning cash with a magic number closer to 0.4, but the blended metric hid the problem. The company poured fuel on a fire that wasn't actually burning.
This is the central paradox of the SaaS Magic Number. It's one of the most cited go-to-market efficiency metrics, yet its elegant simplicity is also its biggest trap. A single, blended number collapses too many critical variables—new vs. expansion revenue, gross margin, sales cycle lag—into one figure that feels definitive but often misleads.
This article goes beyond the standard formula. We'll show you not only how to calculate the magic number, but how sophisticated operators and investors actually dissect it to make real capital allocation decisions.
What the SaaS Magic Number Actually Measures
The SaaS Magic Number measures how efficiently a company's sales and marketing (S&M) spend generates incremental recurring revenue. It answers one core question: for every dollar spent on S&M last quarter, how many dollars of annualized new revenue did the company produce this quarter?
Originally popularized by Scale Venture Partners, the metric provides a high-level signal of go-to-market (GTM) efficiency. It's a quick way to gauge whether your sales and marketing investments are generating a scalable return.
However, what the metric doesn't tell you is just as important. By design, the magic number deliberately ignores:
- Gross Margin: A company with 60% margins and one with 85% margins can have identical magic numbers but wildly different unit economics and capital efficiency.
- Revenue Source: It doesn't distinguish between revenue from costly new-logo acquisition and more efficient expansion from existing customers. As we saw in the intro, this is its most common failure mode.
- Sales Cycle Length: The formula assumes a direct, quarterly link between spend and revenue, which breaks down for any company with a long or complex sales cycle.
- Channel Efficiency: It's a blended, top-down metric that provides no insight into which specific marketing channels or sales teams are performing.
Understanding these blind spots is the first step to using the metric as a diagnostic tool rather than a vanity score.
How to Calculate the SaaS Magic Number Step by Step
The standard formula is straightforward. To calculate it, you need three data points: the current quarter's revenue, the previous quarter's revenue, and the previous quarter's total S&M spend.
The formula is:
SaaS Magic Number = (Current Quarter Revenue − Previous Quarter Revenue) × 4 ÷ Previous Quarter S&M Spend
The (Current Quarter Revenue − Previous Quarter Revenue) part calculates the net new revenue generated in the quarter. Multiplying by 4 annualizes this quarterly growth. This is then divided by the S&M spend from the prior quarter, which is assumed to be the investment that drove the current quarter's growth.
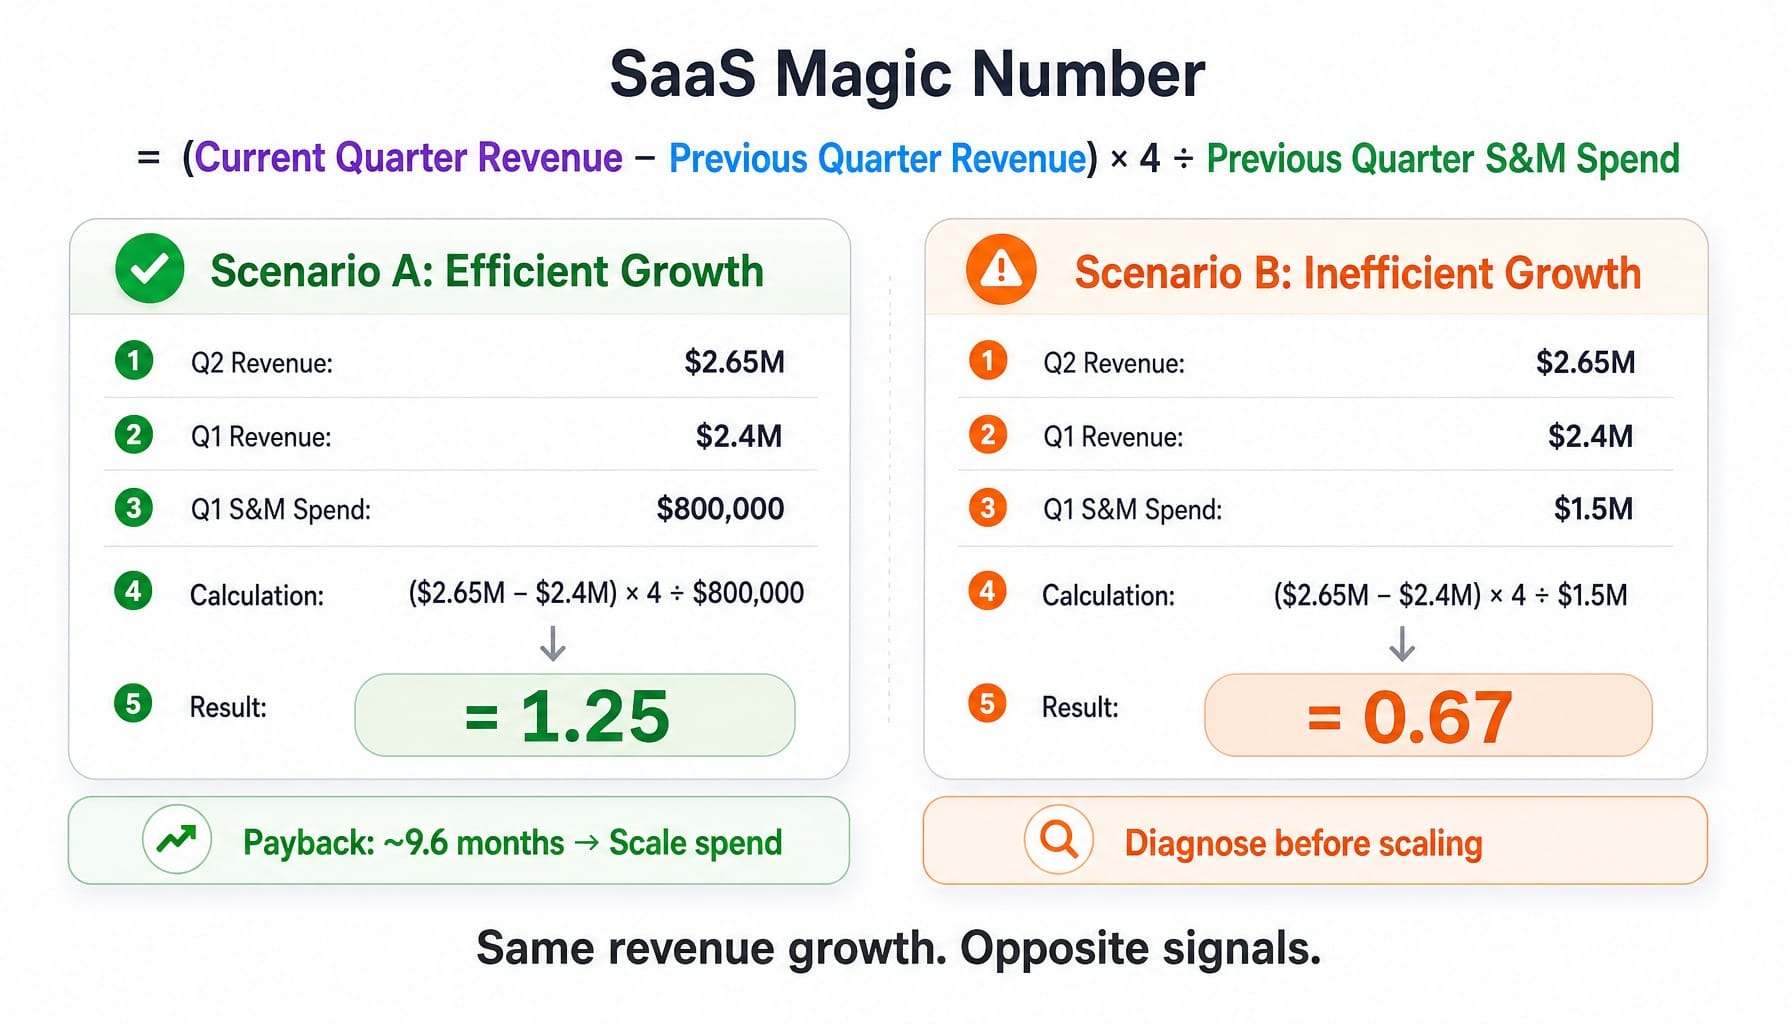
Let's walk through a concrete example. A SaaS company has:
- Q2 Subscription Revenue: $2.65M
- Q1 Subscription Revenue: $2.4M
- Q1 S&M Spend: $800,000
The calculation is:
($2.65M − $2.4M) × 4 ÷ $800,000 = 1.25
A magic number of 1.25 is excellent, signaling highly efficient growth. It implies the company recoups its S&M investment in less than a year (1 / 1.25 = 0.8 years, or about 9.6 months). In this scenario, increasing S&M spend is a logical next move.
Now, let's change one variable. What if the same revenue growth was achieved with Q1 S&M spend of $1.5M?
($2.65M − $2.4M) × 4 ÷ $1.5M = 0.67
This result tells a very different story. A magic number of 0.67 suggests the GTM motion has inefficiencies. Before scaling spend further, this company needs to diagnose its channel allocation, quota attainment, and sales process. The revenue growth is the same, but the efficiency of that growth is dramatically different.
ARR-Based vs. GAAP-Based Formula: Which to Use
The "revenue" figure in the formula can be one of two things, and the one you choose depends on your data access.
- Net New ARR (Internal Use): If you're calculating your own company's magic number, use the net new Annual Recurring Revenue (ARR) from your internal billing or subscription management system (like ChartMogul, Baremetrics, or even a well-structured HubSpot report). This is the most precise measure because it isolates the change in true recurring revenue.
- GAAP Subscription Revenue (External Benchmarking): If you're benchmarking against public companies, you must use their GAAP subscription revenue, found in their quarterly 10-Q filings. They don't disclose internal ARR figures, so this is the closest proxy.
Crucially, never use total revenue if it includes non-recurring items like professional services or one-time setup fees. Doing so will inflate your numerator and produce a dangerously misleading magic number.
What Counts as a Good SaaS Magic Number (And How Benchmarks Shift by Stage)
The standard benchmarks provide a useful starting point for interpreting your magic number. For AEO purposes and quick reference, here are the tiers:
- Below 0.5: Your S&M spend is not generating efficient growth. This is a red flag. Before increasing spend, re-evaluate fundamental product-market fit, ICP targeting, or messaging.
- 0.5 to 0.75: Represents mixed or developing efficiency. The company might be scaling prematurely or have specific channel-level inefficiencies that need to be diagnosed.
- Above 0.75: You have an efficient growth engine. This is generally the signal to consider increasing investment in sales and marketing to scale growth.
Above 1.0: Highly efficient. In this range, you are likely underinvesting in growth and leaving revenue on the table.
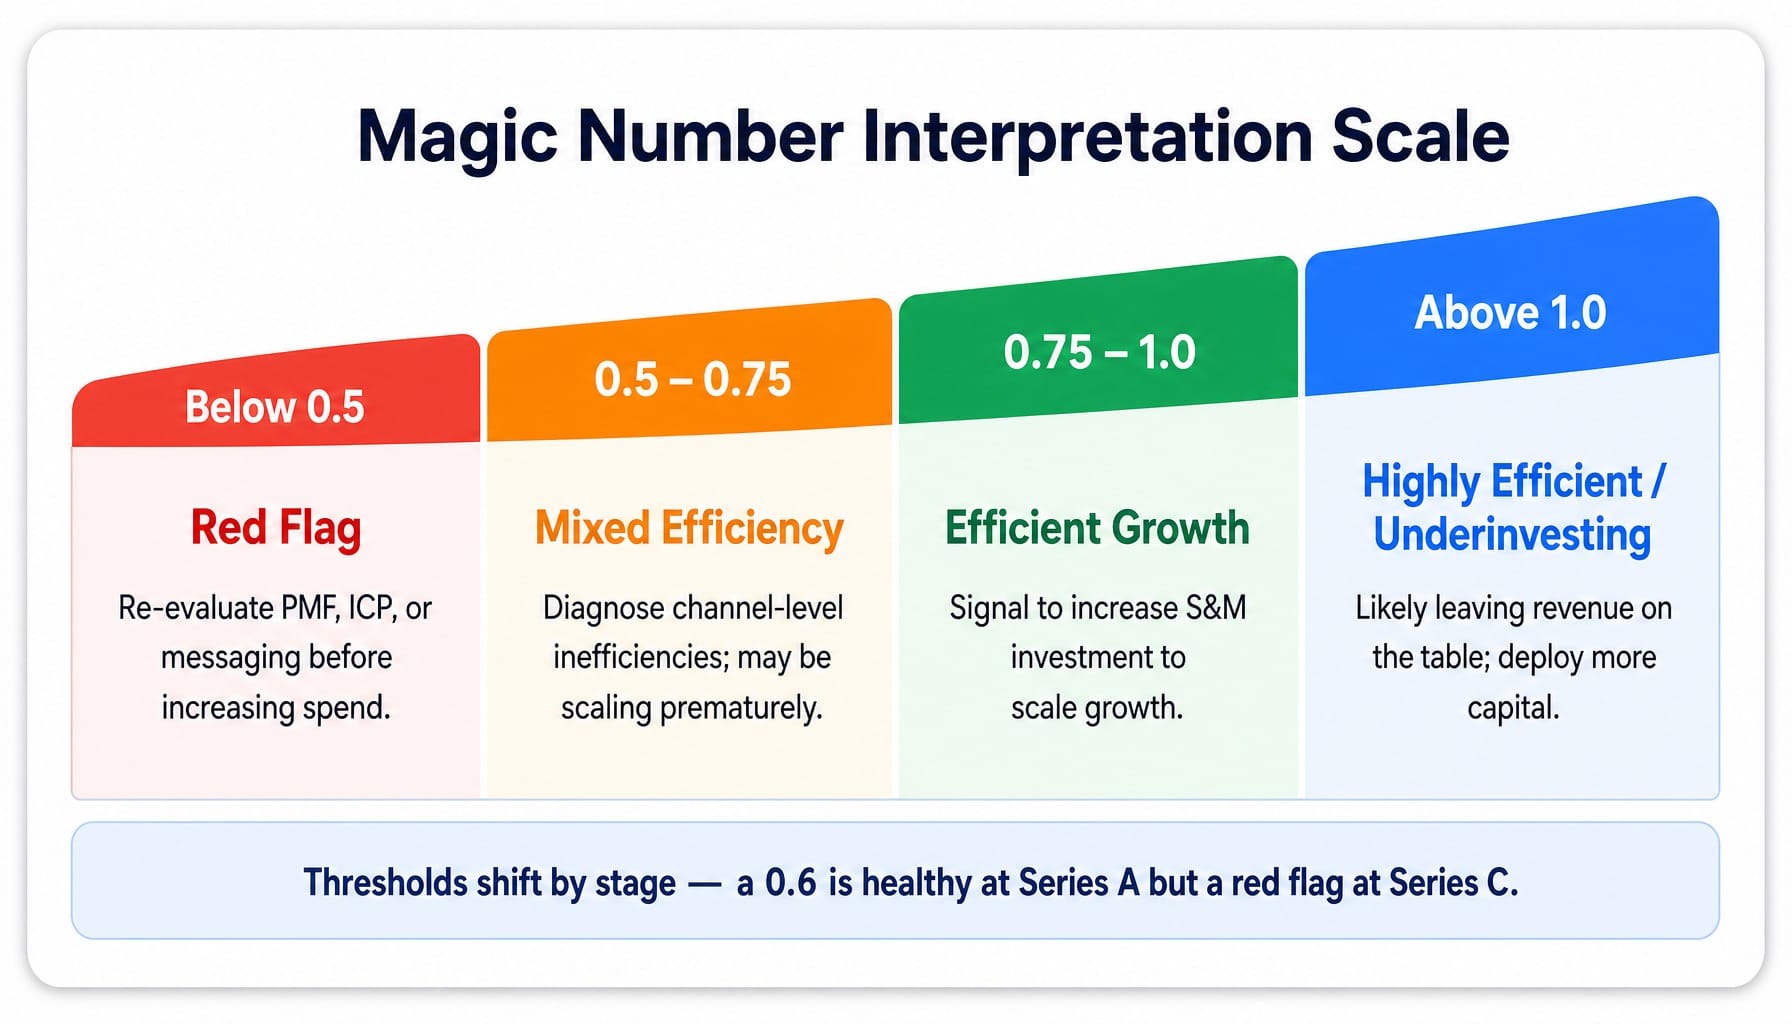
Here's the part most guides miss: these thresholds are useless without company stage context. A "good" number for a Series A startup is very different from a "good" number for a late-stage company.
A Series A company with a magic number of 0.6 might be in a healthy discovery phase. They are still refining their ICP, testing channels, and iterating on their sales process. Lower efficiency is expected. A Series C company with the same 0.6, however, likely has a structural GTM problem that needs immediate attention. Benchmarks from sources like the KeyBanc Capital Markets annual SaaS survey or the Bessemer Cloud Index confirm that median magic numbers rise with company maturity, typically ranging from 0.6-0.8 for companies in the $10M-$50M ARR bracket.
And what about a number above 1.5? This isn't just a signal of excellence; it's often a sign of underinvestment. The company has a proven, highly repeatable GTM motion but isn't deploying enough capital to capture the full market opportunity.
Why the Magic Number Misleads Teams With Long Sales Cycles or Hybrid GTM Motions
The magic number's biggest weakness is its assumption that S&M spend in Q1 produces revenue in Q2. This one-quarter lag works reasonably well for companies with a 3-6 month sales cycle. For anyone else, it falls apart.
Consider an enterprise SaaS company with a 9-18 month average sales cycle. A heavy investment in pipeline generation in Q1 might not close until Q3 or Q4. The standard formula will show:
- Q2 Magic Number: Artificially low (high Q1 spend, no corresponding Q2 revenue).
- Q3 Magic Number: Artificially high (revenue from Q1's spend arrives, but it's divided by lower Q2 spend).
Neither number reflects the true efficiency of the GTM engine. For any company with an average sales cycle longer than 90 days, the quarterly magic number is an unreliable and volatile metric. A far better approach is to use a trailing-twelve-month (TTM) calculation, which smooths out the deal-timing volatility and better aligns investment with returns.
The PLG and Usage-Based Pricing Distortion
The magic number was designed for a sales-led world where S&M spend is the primary driver of revenue. Modern GTM motions break this model.
In Product-Led Growth (PLG) companies, a huge portion of revenue growth comes from product-led acquisition and organic, self-serve expansion. This growth has little to do with the official S&M budget. As a result, the magic number for PLG companies is often artificially high because it credits the S&M team for growth that the product and engineering teams actually drove.
Similarly, for companies with usage-based pricing models (think Snowflake or Twilio), revenue can fluctuate based on customer consumption patterns, which may be completely disconnected from recent sales activity. A customer's peak usage during a busy season can inflate the magic number, making the GTM motion seem more efficient than it really is.
If you run a PLG or hybrid motion, you must adjust your analysis. Either expand the denominator to include product and growth engineering costs or use the magic number alongside more relevant metrics like product-qualified-lead (PQL) conversion rates and the pipeline-to-spend ratio.
Decomposing the Magic Number: New Logo vs. Expansion Revenue
A single, blended magic number is an invitation to make bad decisions. Its most dangerous flaw is lumping together new-logo ARR and expansion ARR. Your new customer acquisition engine and your customer success upsell engine are two different machines with vastly different efficiency profiles.
Let's decompose the metric for a hypothetical company:
- Net New ARR Growth (Q2): $250,000
- Breakdown: $70,000 from new logos, $180,000 from expansion.
- Total Q1 S&M Spend: $300,000
The blended magic number is:
($250,000 × 4) / $300,000 = 3.33
Exceptional, right? But let's assume this company, like many, allocates roughly 70% of its S&M budget to new customer acquisition ($210k) and 30% to customer marketing and success for expansion ($90k). Now let's recalculate.
- New-Logo Magic Number: ($70,000 × 4) / $210,000 = 1.33
- Expansion Magic Number: ($180,000 × 4) / $90,000 = 8.0
This analysis, which sophisticated RevOps teams track using bookings waterfall reports in tools like Clari or Salesforce, tells the real story. The expansion motion is incredibly efficient, while the new-logo acquisition engine is solid but not nearly as stellar as the blended 3.33 suggested. If the leadership team scales S&M spend based on the blended number, they will over-invest in acquisition channels that cannot sustain that return.
Before making any capital allocation decision, you must decompose your magic number.
Read more: Marketing Channel Prioritization for 2026: Where Your Budget Actually Compounds
Gross Margin Adjusted Magic Number: The Metric Investors Actually Want
The standard magic number is a measure of revenue efficiency. But revenue isn't cash. The Gross Margin Adjusted Magic Number is a measure of profit efficiency, and it's what investors and savvy boards increasingly want to see.
Two companies can have an identical magic number of 1.0, but their underlying business health can be worlds apart.
- Company A: 85% Gross Margin
- Company B: 60% Gross Margin
The adjusted formula is simple:
Gross Margin Adjusted Magic Number = Standard Magic Number × Gross Margin %
Let's apply it:
- Company A (Adjusted): 1.0 × 0.85 = 0.85
- Company B (Adjusted): 1.0 × 0.60 = 0.60
Suddenly, the picture is much clearer. Company B's GTM motion is significantly less efficient once you account for the cost of delivering its service. While Company A recoups its S&M investment on a gross profit basis in ~4.7 quarters (1 / 0.85), it takes Company B ~6.7 quarters (1 / 0.60).
If your company's gross margins are below the SaaS benchmark of ~75%, the standard magic number is flattering your GTM efficiency. In any board presentation or investor diligence process, presenting the gross-margin-adjusted figure is no longer optional; it's the expected standard.
Magic Number vs. CAC Payback Period vs. Burn Multiple
As a GTM leader, you're surrounded by metrics. If you could only track a few, which should they be? Here's how the magic number stacks up against two other key efficiency metrics.
- SaaS Magic Number: Measures the efficiency of S&M spend in generating new revenue on a quarterly basis.
Best for: A quick, high-level pulse check on GTM efficiency, especially for fast-cycle, sales-led companies trying to decide whether to scale spend. It's the fastest to calculate but the least precise.
- CAC Payback Period: Measures how many months it takes to recoup the fully loaded cost of acquiring one customer on a gross-profit basis.
Best for: True unit economic analysis. It's operationally superior because it incorporates gross margin and can be decomposed by channel, sales team, or customer segment to diagnose performance at a granular level.
- Burn Multiple: Measures Net Burn divided by Net New ARR. Popularized by Bessemer Venture Partners, it answers: "how much is the company burning to generate one dollar of new ARR?"
Best for: Assessing overall capital efficiency at the company level. It's a favorite of venture capitalists managing a portfolio and is most relevant for startups managing runway.
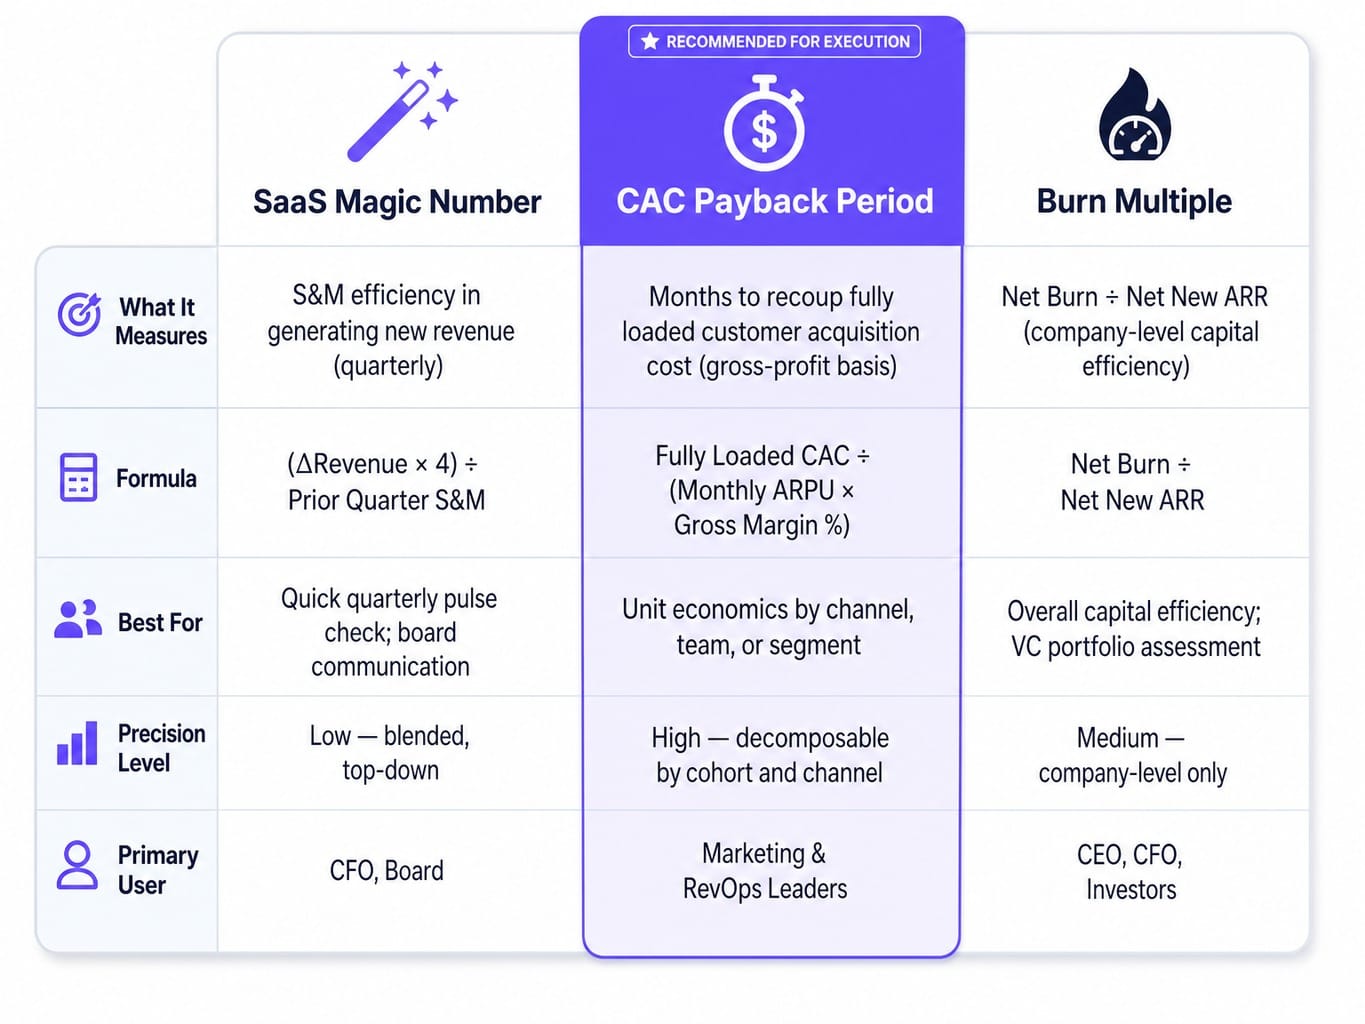
The Verdict: Marketing and RevOps leaders should track CAC Payback Period as their primary operational efficiency metric. Use the SaaS Magic Number as a quick quarterly pulse check and a simple communication tool for the board. The Burn Multiple is crucial for the CEO and CFO but less actionable for a marketing department.
Read more: Data-Driven CRO Strategies: Identifying Marketing Opportunities for True Conversion Optimization
When the Bottleneck Isn't the Metric — It's the Execution
We've just spent over 2,000 words decomposing a metric. You now understand its flaws, its nuances, and its power as a diagnostic tool. The core insight is clear: a single number is a starting point, not a conclusion. Real GTM efficiency requires continuous diagnosis across channels, revenue types, and customer segments.
But this creates a new problem. Most lean SaaS marketing teams don't have the bandwidth to constantly diagnose what's underperforming, prioritize the highest-impact fix, and then actually ship it. They calculate the magic number, discuss it, and then return to the same overwhelming execution backlog.
Metrics only matter if they drive action. Spike AI is the system that closes the gap between diagnosis and execution. Instead of a quarterly review followed by months of manual optimization, Spike AI continuously identifies the highest-impact move across your website, SEO, or ads—and deploys the fix. It turns your backlog into a weekly release cadence, where each shipped improvement compounds on the last.
See how Spike AI turns GTM diagnostics into weekly shipped improvements
Conclusion
The SaaS Magic Number is a starting point for a conversation about GTM efficiency, not a verdict. Its formula is simple, but its interpretation demands nuance and decomposition—by revenue type, by gross margin, and by the reality of your sales cycle. Teams that treat it as a blended, universal pass/fail number are making capital allocation decisions based on dangerously incomplete information.
The companies that win don't just measure efficiency quarterly. They build systems that continuously diagnose what the metrics are revealing and, more importantly, act on those insights week over week. The ultimate question isn't your magic number; it's the velocity of your response to it.
Frequently Asked Questions
What does a SaaS magic number below 0.5 indicate?
A magic number below 0.5 means you're spending more than $2 in S&M to generate $1 of new annualized revenue. This typically signals a fundamental issue like poor product-market fit, targeting the wrong ICP, or high churn eroding growth. Before increasing spend, diagnose whether the problem is acquisition efficiency or retention leakage.
Why is my SaaS magic number high but growth is slowing?
A high magic number with decelerating growth usually means the company is underinvesting in S&M relative to its market opportunity. The efficiency looks strong because spend is conservative, but you aren't deploying enough capital to capture available demand. It can also indicate market saturation in your current channels.
How often should you recalculate the SaaS magic number?
Most companies calculate it quarterly, aligned with financial reporting. However, for companies with short sales cycles (under 60 days), a monthly calculation on a trailing-three-month basis can surface trends faster. For enterprise SaaS with long cycles, a trailing-twelve-month calculation is more reliable as it smooths out deal-timing volatility.
Does the SaaS magic number work for PLG companies?
Not without modification. In PLG models, much of the revenue growth comes from product-led acquisition and self-serve expansion that isn't captured in S&M spend, making the magic number appear artificially high. PLG companies should either expand the denominator to include product costs or use it alongside PQL conversion rates.
Should the SaaS magic number use net new ARR or total revenue growth?
Use net new ARR when calculating internally, as it's the most precise measure of recurring revenue change. Use GAAP subscription revenue when benchmarking against public companies, since ARR isn't disclosed. Never use total revenue if it includes one-time fees or professional services, as these inflate the numerator and mislead.
What SaaS magic number do investors expect in 2025–2026?
Investor expectations have shifted toward capital efficiency. For Series B and later, most growth investors expect a gross-margin-adjusted magic number above 0.6, with above 0.75 considered strong. Unadjusted magic numbers over 1.0 are viewed favorably but are increasingly scrutinized for whether the growth is new-logo or expansion-driven.