
The Martech Stack Audit That Reveals What Your Tools Actually Cost

TL;DR
- Your martech stack's true cost isn't the subscription fee; it's the "Stack Tax"—the loaded cost of labor, friction, and unshipped work, often 5-10x the sticker price.
- Use the four-phase audit methodology: Inventory (what you have), Utilization (if you use it), Integration Mapping (how it connects), and Output Assessment (if it drives action).
- Calculate your "ship rate"—the percentage of a tool's recommendations that result in a shipped change. A rate below 10% signals a major execution gap.
- Use the Ship-or-Cut Matrix (Cost vs. Output) to make decisive choices: Keep and Invest, Cut or Replace, Double Down, or Sunset Quietly.
- The goal of a martech stack audit isn't just to cut costs; it's to reclaim the bandwidth your team loses to tool maintenance and redirect it to shipping work that grows the business.
Most lean B2B marketing teams know what they pay for their tools. A typical 4-5 tool stack—CRM, SEO platform, analytics, email, and CMS—runs a manageable $500–$800 per month. That's the sticker price.
The real cost is hidden. When you add the hours spent maintaining integrations, manually reconciling data between platforms, and troubleshooting broken connections, the number climbs. When you factor in the opportunity cost of every insight that never gets shipped because the team simply ran out of bandwidth, the loaded cost isn't $800 a month. It's closer to $6,000.
This gap is the Stack Tax: the invisible overhead your marketing technology imposes on your team's time, attention, and output.
This article provides a system for making that cost visible. We'll introduce a formula for calculating your Stack Tax, a four-phase martech stack audit for diagnosing its source, and a decision framework—the Ship-or-Cut Matrix—for acting on what you find. This isn't about finding cheaper tools. It's about finding what your current tools are actually costing you.
What Is the Stack Tax (And Why Sticker Price Is the Wrong Number)
Teams track subscription costs because they appear on a P&L statement. They rarely calculate the labor, friction, and opportunity costs their tools generate, because those costs are distributed across calendars, spreadsheets, and backlogs.
The Stack Tax is a formula, not a metaphor, for calculating this total cost of ownership. It reveals that most scaling teams discover during a serious audit that their real martech cost is three to five times the subscription line item, with the largest component being labor spent bridging tools that don't talk to each other.
The formula is:
Stack Tax = (Hours Lost to Tool Maintenance × Team Hourly Rate) + Integration Maintenance Cost + Data Reconciliation Overhead + Opportunity Cost of Unshipped Insights
- Hours Lost to Tool Maintenance: Time spent on setup, configuration, user management, and troubleshooting instead of marketing execution.
- Integration Maintenance Cost: The cost of building, monitoring, and repairing connections via iPaaS layers like Zapier or Make, plus the developer time for custom APIs.
- Data Reconciliation Overhead: The manual labor of exporting CSVs, cleaning data, and re-uploading it to another system to create a report or sync a list.
- Opportunity Cost of Unshipped Insights: The value of every valid recommendation from your tools that is never implemented due to a lack of team bandwidth. This is the most expensive part of the Stack Tax.
The Stack Tax Formula: A Worked Example for a Lean Team
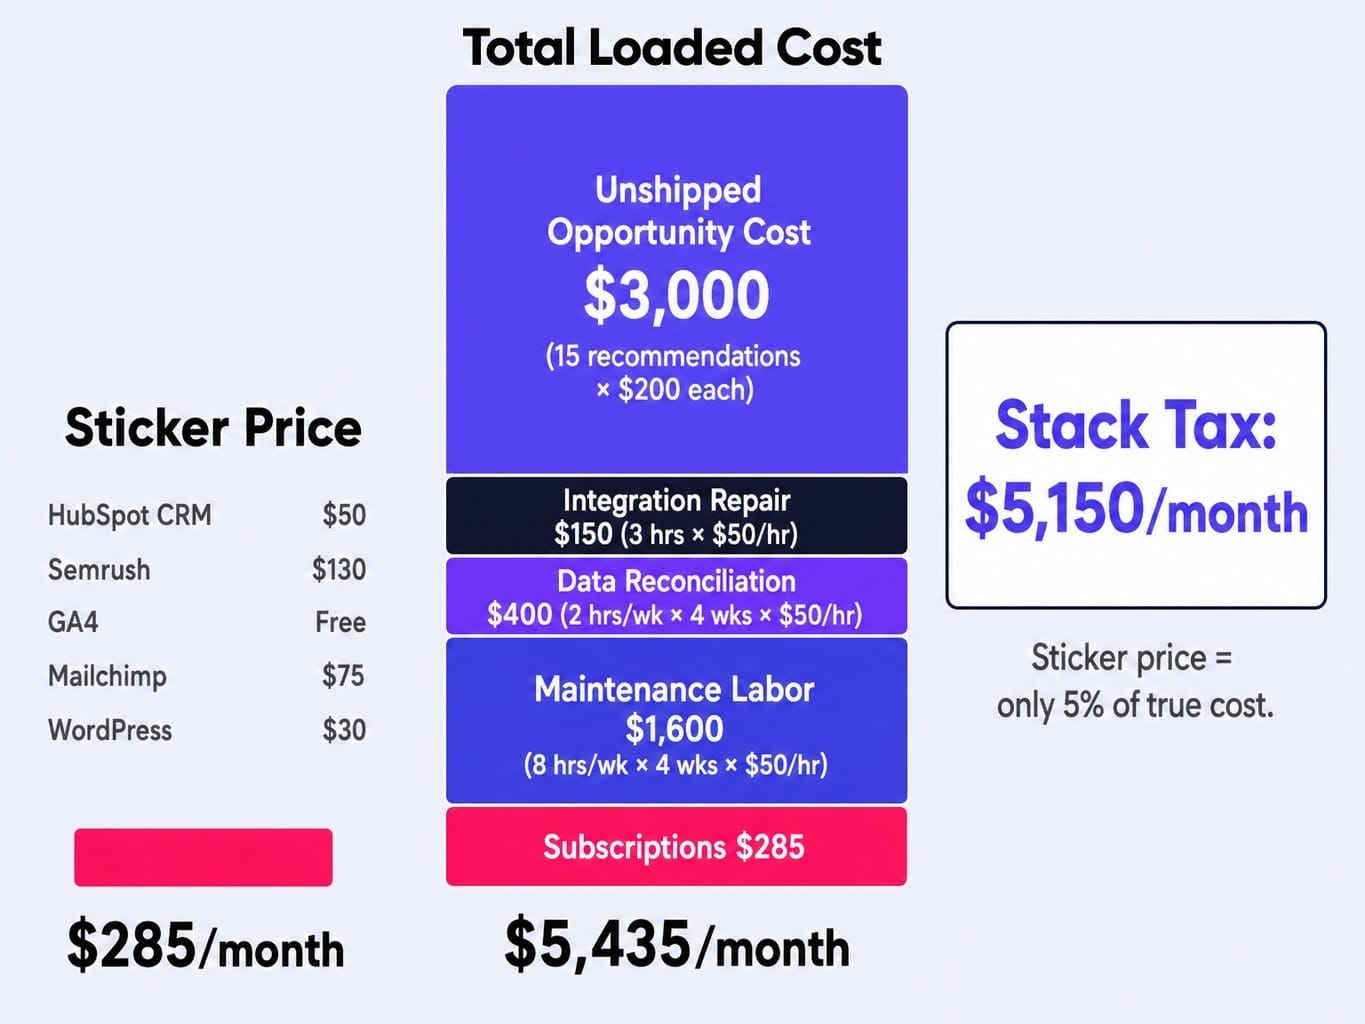
Consider a typical 3-person B2B SaaS marketing team with an effective hourly rate of $50/hour.
Their tool subscriptions look reasonable:
- HubSpot CRM: $50/mo
- Semrush: $130/mo
- Google Analytics 4: Free
- Mailchimp: $75/mo
- WordPress: $30/mo
- Total Sticker Price: $285/month
Now, let's calculate their Stack Tax:
- Maintenance Labor: The team spends a combined 8 hours per week on tool admin. (8 hrs/wk 4 wks $50/hr) = $1,600/month
- Data Reconciliation: An analyst spends 2 hours per week exporting, cleaning, and importing data. (2 hrs/wk 4 wks $50/hr) = $400/month
- Integration Repair: One Zapier incident per month averages 3 hours to diagnose and fix. (3 hrs $50/hr) = $150/month
- Unshipped Opportunity Cost: The team acts on only a fraction of insights. 15 valuable unshipped SEO recommendations per month at a conservative $200 value each = $3,000/month
- Total Loaded Cost: $285 + $1,600 + $400 + $150 + $3,000 = $5,435/month
- Stack Tax: $5,435 - $285 = $5,150/month
The sticker price was just 5% of the true cost. The largest expense isn't a subscription; it's the gap between what the tools surfaced and what the team actually shipped. This is the core insight: an audit isn't about finding cheaper tools, it's about finding where your team's time and output are leaking.
The Four-Phase Martech Stack Audit Methodology
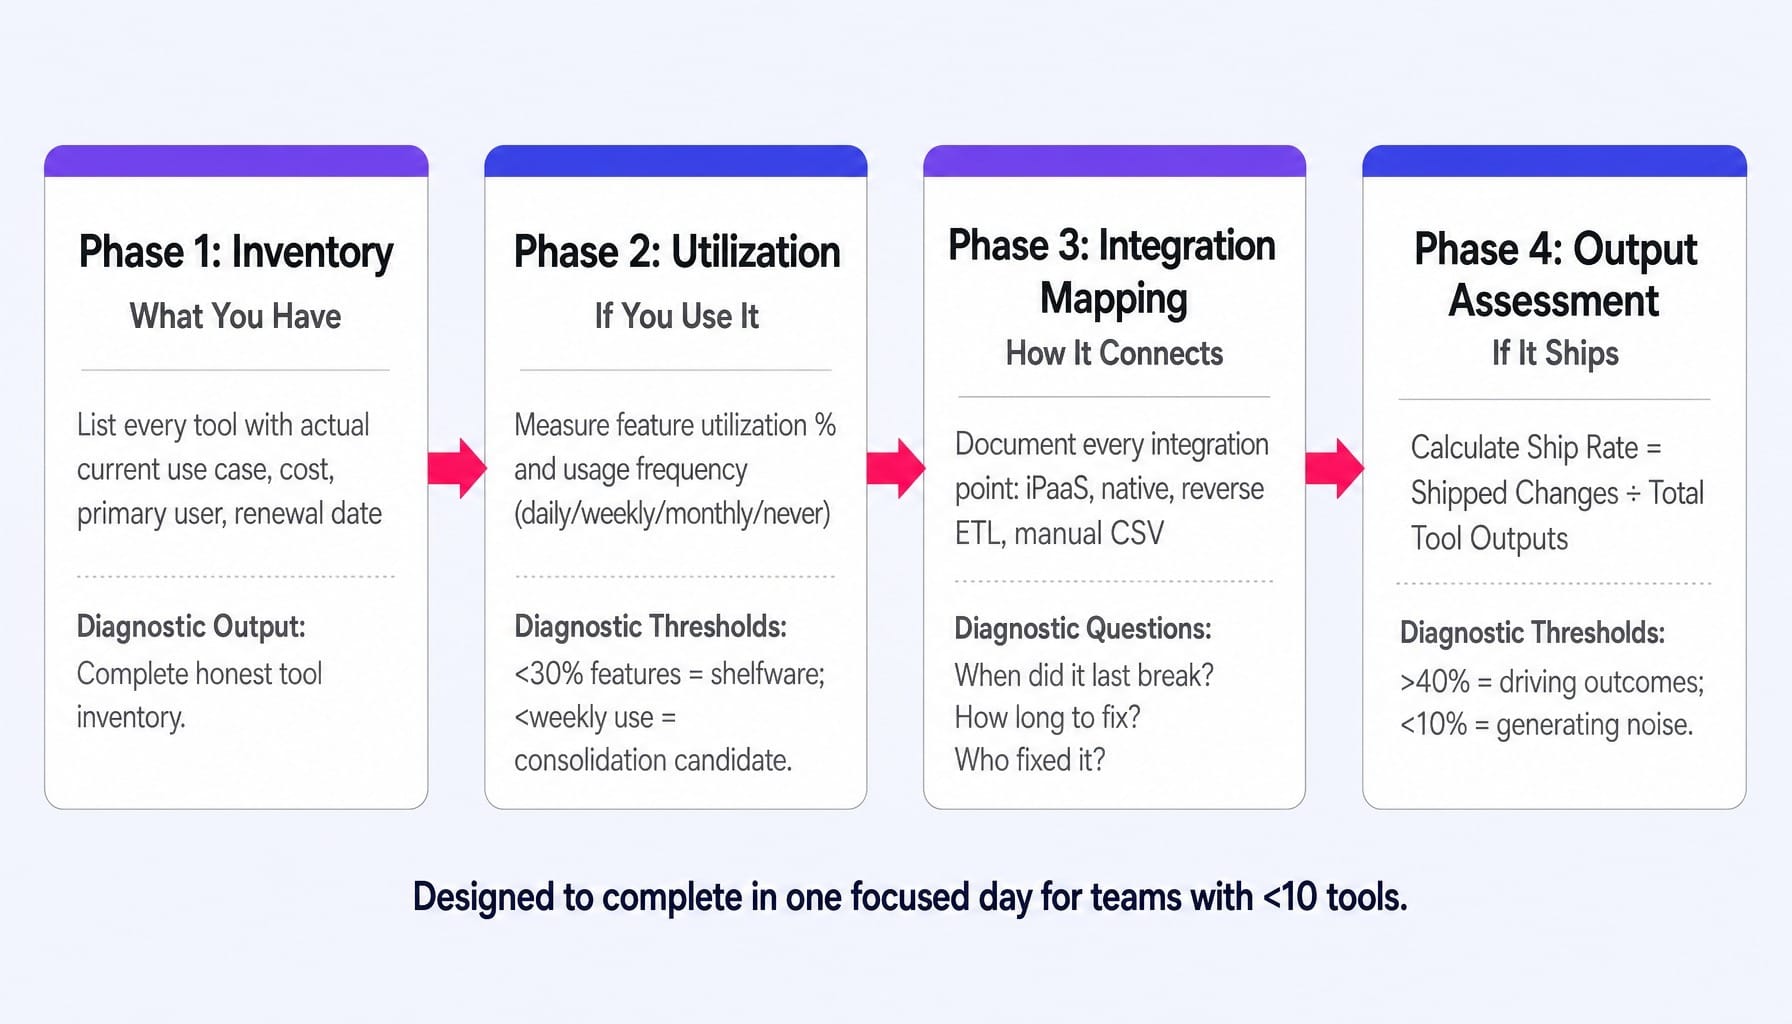
The Stack Tax tells you the size of the problem; this four-phase audit tells you where it lives. The process moves from inventory (what you have) to utilization (if you use it), to integration health (how the tools connect), and finally to output assessment (if anything actually ships).
This audit is designed to be completed in a single focused day for a team running under 10 tools, not a multi-week consulting engagement. Each phase builds on the last, turning a vague sense of "stack bloat" into a concrete, actionable diagnosis.
Phase 1 – Inventory: What You Actually Have (Not What You Think You Have)
Most teams cannot produce a complete list of their marketing tools from memory. Shadow martech—tools individual team members signed up for, free tiers still running, browser extensions with data access—creates expensive blind spots.
The first step is to open a shared spreadsheet with five columns:
- Tool Name
- Monthly/Annual Cost
- Primary User(s)
- What It's Used For This Month
- Contract Renewal Date
The critical instruction here is for column four. "What it's used for this month" means the actual, specific use case in the last 30 days, not the aspirational use case from the sales demo. A tool bought for "predictive lead scoring" that's only used for "exporting contact lists" must be listed as "exporting contact lists." This honesty is non-negotiable.
To find every tool, check company credit card statements, expense reports, and single sign-on (SSO) dashboards from platforms like Zylo or Productiv. Look for seat creep—tools where you're paying for 10 licenses but only three people have logged in this quarter.
The output of this phase is a complete, honest inventory. This is the foundation for the rest of the audit.
Phase 2 – Utilization: The 30% Rule and the Weekly-Use Threshold
Having a tool is not the same as using it. And using a tool is not the same as using enough of it to justify its cost. This phase introduces two diagnostic thresholds for evaluating martech stack performance.
First, feature utilization. For each tool in your inventory, estimate the percentage of its core capabilities your team actively uses. As a rule of thumb among marketing ops leaders, if it's below 30%, the tool is effectively shelfware. You're paying for a platform but using it as a point solution.
Second, frequency of use. Categorize each tool's usage as daily, weekly, monthly, or never. Any tool used less than weekly is a candidate for consolidation or replacement, as it's not part of your team's core operating rhythm.
Consider a team paying $130/month for Semrush. They use the keyword tracking module weekly but ignore site audit, backlink analysis, content optimization, and competitive intelligence features. Their feature utilization is roughly 15%. That's not a $130 SEO platform; it's a $130 rank tracker.
It's important to remember that utilization rate and value rate are different metrics. A tool can show high login frequency and still deliver near-zero value if the team only uses it for a function available natively in another platform they already pay for. Low utilization isn't always the tool's fault; it's often a signal of constrained bandwidth—a core symptom of a high Stack Tax.
Phase 3 – Integration Mapping: Finding Zombie Integrations
The connections between your tools are often more fragile and expensive than the tools themselves. A collection of tools that grew organically without architectural intent becomes a frankenstack, held together by undocumented connections.
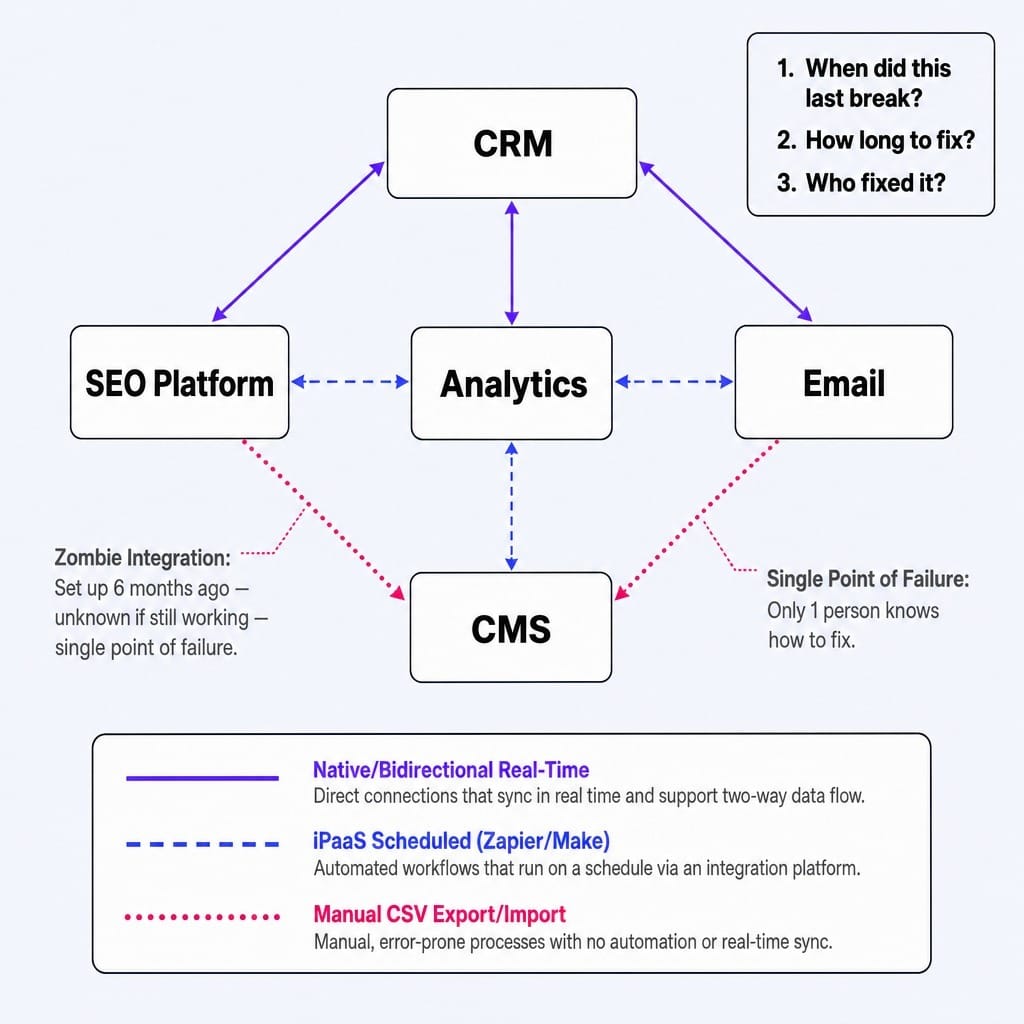
This is where you find zombie integrations: connections that were set up months ago, may or may not still work, and nobody is sure what breaks if they're turned off.
The method is to map your integration architecture. For each tool, document every integration point:
- iPaaS connections (Zapier, Make, Workato)
- Native, in-app integrations
- Reverse ETL pipelines (Hightouch, Census)
- Manual CSV export-import cycles
I once mapped every integration in a 12-tool stack and found that five of them were maintained through manual CSV exports run weekly by a single analyst. When that analyst went on leave, three downstream workflows silently broke, and no one noticed until campaign attribution diverged from CRM data by over 30%. This is why assessing integration health isn't just checking if a connection exists; the critical distinction is whether data flows bidirectionally in real-time, unidirectionally on a schedule, or through a manual export someone remembers to run.
For each integration, answer three questions:
- When was the last time this broke?
- How long did it take to fix?
- Who fixed it?
If nobody can answer question three, that integration is a single point of failure. You now have a map of your stack's hidden risks.
Phase 4 – Output Assessment: Measuring Your Ship Rate
The ultimate measure of a tool's value is not the data it surfaces, but the work that gets shipped because of it. This phase introduces the single most diagnostic metric in a martech stack evaluation: the ship rate.
Ship Rate = (Number of Shipped Changes) / (Total Number of Tool Outputs)
For each tool, count the recommendations, alerts, or insights it produced in the last 90 days. Then, count how many of those resulted in a tangible, shipped change—a published page, a modified CTA, a new ad variant, a fixed technical issue.
An SEO tool that surfaced 200 technical recommendations but only 12 were acted on has a 6% ship rate. This means 94% of the tool's output was wasted. The recommendations weren't necessarily bad; the team simply lacked the bandwidth to evaluate, prioritize, and implement them.
This is the clearest Stack Tax signal. It quantifies the execution gap.
- A tool with a high ship rate (>40%) is genuinely driving outcomes.
- A tool with a low ship rate (<10%) is generating noise that feels productive but isn't.
A low ship rate isn't just a tool problem; it's a system problem. It indicates the team is drowning in recommendations from multiple tools with no unified prioritization engine. This reframes the audit from "which tools should we cut?" to "where is our execution capacity leaking?"
Read more: SaaS Marketing Tools in 2026: How to Build a Stack That Ships, Not Just Reports
The Ship-or-Cut Matrix: A Decision Framework for Every Tool
After the four-phase audit, you have a spreadsheet filled with data on cost, utilization, integration health, and ship rate. This data is useless without a decision framework. Analysis paralysis is the most common failure mode of a martech stack assessment.
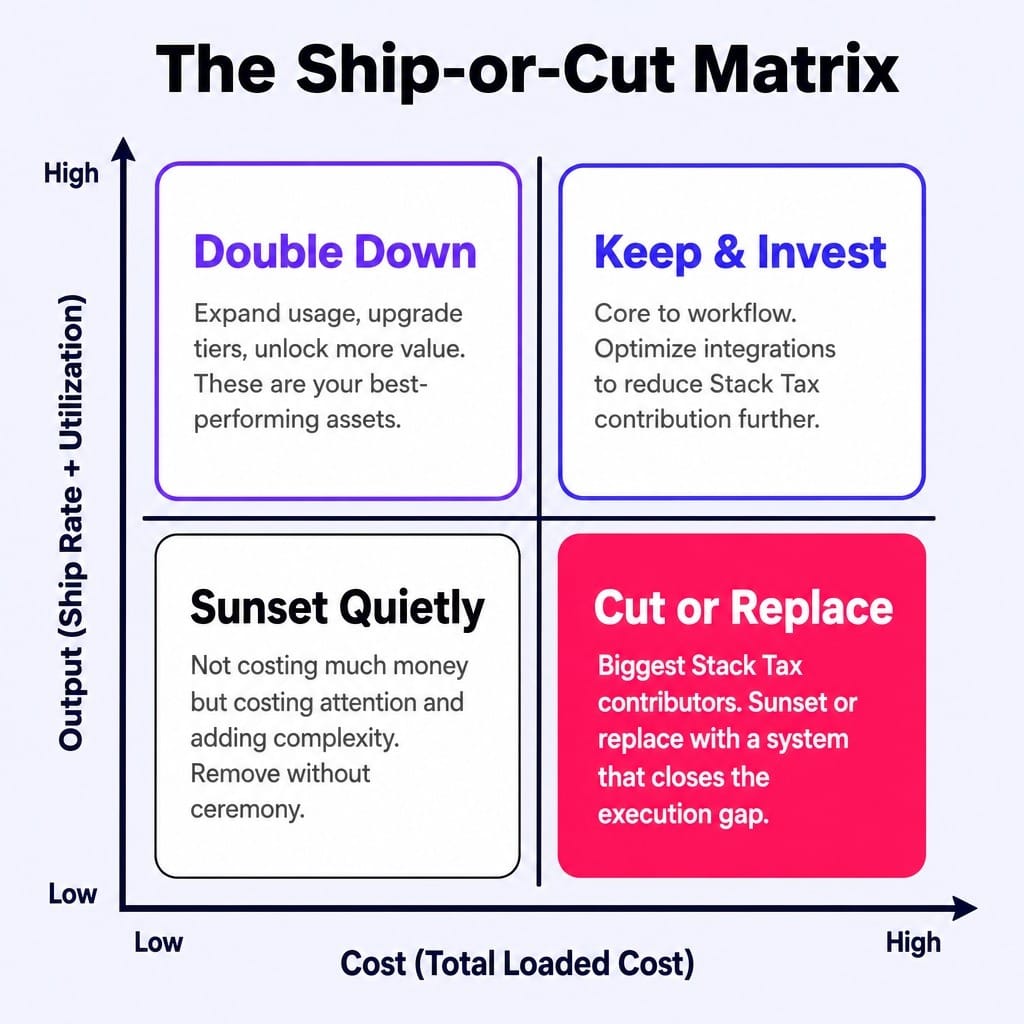
The Ship-or-Cut Matrix provides that framework. It's a 2x2 grid that plots each tool based on its loaded cost and its output.
- X-Axis: Cost (Low to High). This is the tool's total loaded cost, including its contribution to the Stack Tax, not just its subscription price.
- Y-Axis: Output (Low to High). This is a combined score based on its ship rate (Phase 4) and utilization score (Phase 2).
This plots every tool into one of four quadrants, each with a clear action:
- High Cost / High Output (Keep & Invest): These tools are earning their keep. They are core to your workflow and drive real outcomes. The action here is to optimize their integrations and workflows to reduce their Stack Tax contribution even further.
- High Cost / Low Output (Cut or Replace): These are your biggest Stack Tax contributors. They are expensive and generate more noise than action. The choice is binary: sunset them or replace them with a system that closes the execution gap.
- Low Cost / High Output (Double Down): These are your best-performing assets. They deliver high value for a low loaded cost. Consider expanding their usage across the team or upgrading tiers to unlock more value.
- Low Cost / Low Output (Sunset Quietly): These tools aren't costing much money, but they are costing attention, creating cognitive load, and adding complexity. Remove them without ceremony.
This matrix turns a complex dataset into a simple, visual decision-making tool that can be shared with leadership to justify budget and resourcing decisions.
What Your Stack Tax Number Tells You (And What to Do Next)
Your final Stack Tax number provides a clear diagnosis of your marketing system's health.
- If your Stack Tax is 2–3x your sticker price, your stack is relatively healthy but has clear optimization opportunities.
- If it's 5x or higher, you have a structural execution problem. Swapping one tool for another won't fix it. The issue is the systemic gap between what your tools surface and what your team can ship.
- If it's 10x or higher, you're effectively paying for a full-time employee who does nothing but maintain your tools.
The audit reveals the problem; the next step is to act. There are three distinct paths forward based on your findings:
- For Cost-Cutting: If your audit revealed significant tool overlap analysis opportunities and high subscription costs for low-output tools, your next step is tactical cost reduction. This involves renegotiating contracts, consolidating redundant platforms, and strategically planning contract co-terming.
- For Performance Improvement: If the primary issue is low utilization and fragile integrations, the focus should be on optimization. This means increasing adoption through training, fixing broken data flows, and improving your overall data flow mapping.
- For Systemic Gaps: If your audit uncovered a fundamentally low ship rate across the board, you're facing an execution bottleneck that is an industry-wide problem. The issue isn't any single tool; it's the manual work required to operate all of them in sequence.
Read more: Stop Syncing Strategy and Execution: Platforms That Unify Marketing Goals With Task Management
When the Stack Tax Is an Execution Problem, Not a Tool Problem
The audit you just completed likely revealed a difficult truth: the largest component of your Stack Tax isn't subscription fees or even integration maintenance. It's the opportunity cost of unshipped insights. The SEO tool surfaced 200 recommendations, and 12 got shipped. The analytics platform flagged three conversion bottlenecks, and none were fixed this quarter.
The problem isn't that your tools are bad. The problem is that your team doesn't have the bandwidth to act on what the tools surface.
This is the specific execution gap Spike AI is designed to close. Spike isn't another tool to add to your stack; it's the execution layer that collapses the distance between insight and shipped change. It continuously identifies the highest-impact optimization across your website, SEO, and conversion funnel—and then it ships it. Weekly.
The ship rate goes from 6% to near-100% because the friction between "recommendation" and "deployed change" is removed. Teams using Spike AI see their effective ship rate increase from single digits to over 80% within the first month, while often reducing their total tool count. Your audit revealed that your biggest cost isn't your tools—it's the work your tools create but your team can't finish. Spike AI finishes it.
See how Spike AI closes the execution gap your audit just uncovered →
Conclusion
The defining belief shift of a proper martech stack audit is this: your stack's real cost is not what you pay for it—it's what it costs you in time, friction, and unshipped work.
The Stack Tax formula makes that cost calculable. The four-phase audit makes it diagnosable. And the Ship-or-Cut Matrix makes it actionable.
Run the audit this week. Calculate your Stack Tax number. If the result surprises you, that's the point. The gap between sticker price and loaded cost is where most marketing teams lose their quarter, buried in work that feels productive but doesn't move the needle. The first step to fixing the system is measuring it honestly.
Frequently Asked Questions
How often should you run a martech stack audit?
A full four-phase audit should happen annually or whenever your team adds or removes a major tool. However, Phase 4 (ship rate measurement) should be tracked continuously. Monitoring it monthly reveals execution trends before they become expensive. Contract renewal dates are also natural audit triggers for a full review.
Who should be involved in a martech stack audit?
The audit owner should be whoever manages the marketing budget, but every person who uses a tool must contribute to the inventory and utilization phases. They are the only source of truth on actual usage. Include a RevOps or IT stakeholder for the integration mapping phase, as they often own connections the marketing team isn't aware of.
What is the difference between a martech audit and a martech maturity assessment?
A martech audit evaluates what you have and whether it's working; it's diagnostic and tool-specific. A maturity assessment evaluates your team's capability to use technology effectively; it's strategic and process-focused. You need the audit first. A maturity assessment without an honest inventory is just theory without evidence.
How do you handle stakeholder resistance when sunsetting a tool?
Use the ship rate. A tool with a 6% ship rate means 94% of its output is ignored—that is hard to defend, regardless of personal preference. Frame the conversation around its total loaded cost (its Stack Tax contribution), not its sticker price. People are less attached to a tool when they see it costs the company thousands per month in wasted output.
Should you consolidate to a platform or maintain a best-of-breed stack?
Neither is universally correct; the audit data decides. If your integration map shows more than five fragile, manual connections between point solutions, consolidation will likely reduce your Stack Tax. If your utilization scores show you're using less than 30% of a platform's features, you're paying platform prices for point-solution usage and should de-bundle.