
SaaS Marketing Benchmarks 2026: A Guide for the Efficiency Era

TLDR
- Median benchmarks are misleading. A B2B SaaS company's performance is only comparable to others with the same go-to-market motion (PLG vs. sales-led) and company stage.
- In the efficiency era (2023-present), investors prioritize metrics like CAC payback period (under 12-18 months), pipe-to-spend ratio (5-8x), and the Rule of 40 over growth at all costs.
- The single biggest constraint isn't knowing your benchmark gaps; it's the lack of execution bandwidth to ship the improvements needed to close them.
- Your MQL-to-SQL conversion rate is less about lead volume and more about ICP fit. A low rate often points to a scoring or definition problem, not a top-of-funnel problem.
- Channel-level CPL benchmarks are useful but incomplete. The "dark funnel" (podcasts, communities) influences 30-50% of pipeline but is invisible to most attribution models.
A Series A marketing lead pulls up a benchmark report. It says the average CAC for B2B SaaS is $340. Her heart sinks. Theirs is $620. She prepares a presentation on how the marketing engine is broken.
But she's wrong.
Her company sells a $45K ACV product through a field sales team. Her CAC isn't just healthy; it's efficient for her segment. The problem isn't her number; it's the benchmark. Unsegmented, context-free data doesn't provide signal; it creates noise that leads smart marketers to solve the wrong problems.
Most SaaS marketing benchmark articles give you numbers without the operating context to make them useful. This one is different.
We'll break down the B2B SaaS marketing benchmarks that matter for 2026, segmented by the variables that actually determine performance: your go-to-market motion, company stage, and the current efficiency climate. We'll cover GTM-specific benchmarks, funnel conversion rates by stage, the efficiency metrics your board actually tracks, and how the macro environment has reset every target you thought you knew.
Why Median SaaS Benchmarks Create False Confidence
Median benchmarks are the most commonly cited and least useful numbers in SaaS. They create a false sense of security or unnecessary panic by blending fundamentally different business models into a single, meaningless average.
Consider a report stating the "median MQL-to-SQL conversion rate for B2B SaaS is 13%." This number is an illusion. It averages two completely different systems:
- Product-Led Growth (PLG) Companies: High volume of low-intent MQLs (e.g., ebook downloads, freemium signups). Their MQL-to-SQL rate is structurally low, often around 6-8%.
- Enterprise Sales-Led Companies: Low volume of highly-qualified, high-intent MQLs (e.g., demo requests for a specific solution). Their MQL-to-SQL rate is structurally high, often 25-30%.
A mid-market SaaS company comparing its 15% conversion rate against the 13% median feels like it's performing adequately. In reality, it might be underperforming for its specific motion. The median describes a company that doesn't exist.
This isn't an isolated issue. Authoritative reports from sources like OpenView Partners and the annual KeyBanc SaaS Survey consistently show that the spread between the 25th and 75th percentile on most core SaaS metrics is massive—often a 2-4x difference. For CAC, LTV, and key conversion rates, the "average" is a poor target because the distribution of performance is incredibly wide.
The only way to use benchmarks effectively is to move from medians to segmented percentiles. You aren't competing against the average; you're competing against companies with a similar architecture. Any benchmark that doesn't specify the go-to-market motion, ACV, and company stage is worse than useless—it's actively misleading.
SaaS Marketing Benchmarks by Go-to-Market Motion
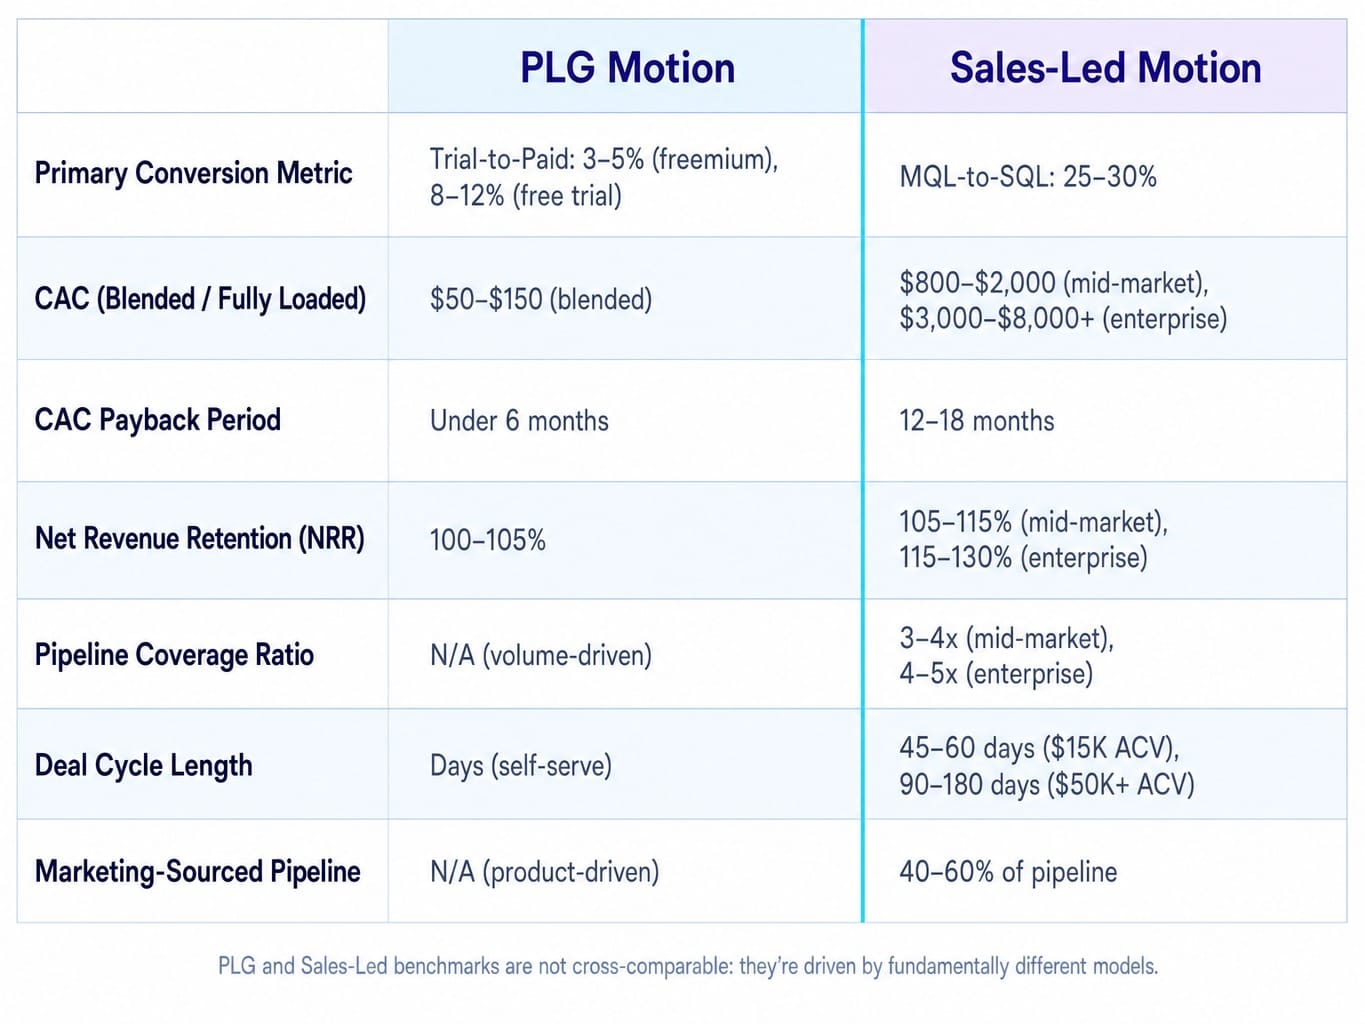
The single most important variable defining "what good looks like" for any SaaS marketing metric is your go-to-market (GTM) motion. A PLG company and a sales-led company at the same ARR are running entirely different economic engines. Benchmarking one against the other is like comparing a sprinter's 100-meter time to a marathoner's—both are running, but the performance model, cost structure, and success metrics are fundamentally incompatible.
Before diving into the numbers, it's critical to distinguish between blended CAC (total sales and marketing cost / total new customers) and fully loaded CAC (which also includes salaries, overhead, and tooling). PLG companies often track blended CAC, while sales-led organizations must track fully loaded CAC to capture the cost of their sales team. As hybrid motions (PLG with a sales-assist layer) become more common, understanding both becomes essential.
PLG Benchmark Profile: Volume, Velocity, and Self-Serve Conversion
The PLG operating model is built on acquiring users at low cost and converting them through the product itself. The benchmarks reflect a focus on top-of-funnel volume, conversion velocity, and self-serve efficiency.
- Trial-to-Paid Conversion Rate: This is the headline metric. For freemium models, a 3-5% conversion rate is a common median. For time-limited free trials, the benchmark is higher, typically 8-12%. However, the most sophisticated PLG teams know that activation rate—the percentage of users who experience the product's core value—is the true leading indicator.
- CAC & Payback Period: Blended CAC is low, often in the $50-$150 range for SMB-focused products. The goal is a rapid CAC payback period, almost always under 6 months.
- Net Revenue Retention (NRR): According to data from sources like ProfitWell by Paddle and ChartMogul, NRR for PLG companies targeting SMBs has a median of 100-105%. This is lower than sales-led counterparts because SMB churn is structurally higher. PLG models compensate for this with a far lower cost of acquisition and faster expansion from a larger user base.
Sales-Led Benchmark Profile: ACV, Pipeline Coverage, and Deal Velocity
The sales-led model is built on high-touch acquisition of high-value customers. Benchmarks center on pipeline quality, sales cycle efficiency, and unit economics that support a more expensive GTM motion.
- CAC & Payback Period: Fully loaded CAC is significantly higher, reflecting the cost of a sales organization. Mid-market CAC is typically $800-$2,000, while enterprise CAC can be $3,000-$8,000+. Consequently, the acceptable CAC payback period is longer, usually 12-18 months.
- Pipeline Coverage Ratio: This is a critical health metric. It's the ratio of total qualified pipeline to the revenue target for a given period. Healthy mid-market teams maintain 3-4x coverage, while enterprise teams often need 4-5x to account for longer cycles and lower win rates.
- Average Deal Cycle & NRR: Deal velocity is measured in months, not days. A $15K ACV deal might close in 45-60 days, while a $50K+ deal can take 90-180 days. The payoff for this longer cycle is higher NRR. According to the KeyBanc SaaS survey, median NRR for mid-market is 105-115%, and for enterprise, it's 115-130%, driven by expansion revenue within large accounts. Top-performing teams also see a 40-60% marketing-sourced pipeline split.
Funnel Conversion Benchmarks Every SaaS Team Should Track
Most SaaS marketing teams have a clear view of top-of-funnel volume (visitors, leads) and bottom-of-funnel outcomes (revenue, bookings). The blind spot is the middle of the funnel—the conversion points where most revenue is won or lost. Knowing these benchmarks provides a diagnostic framework for your entire growth engine.
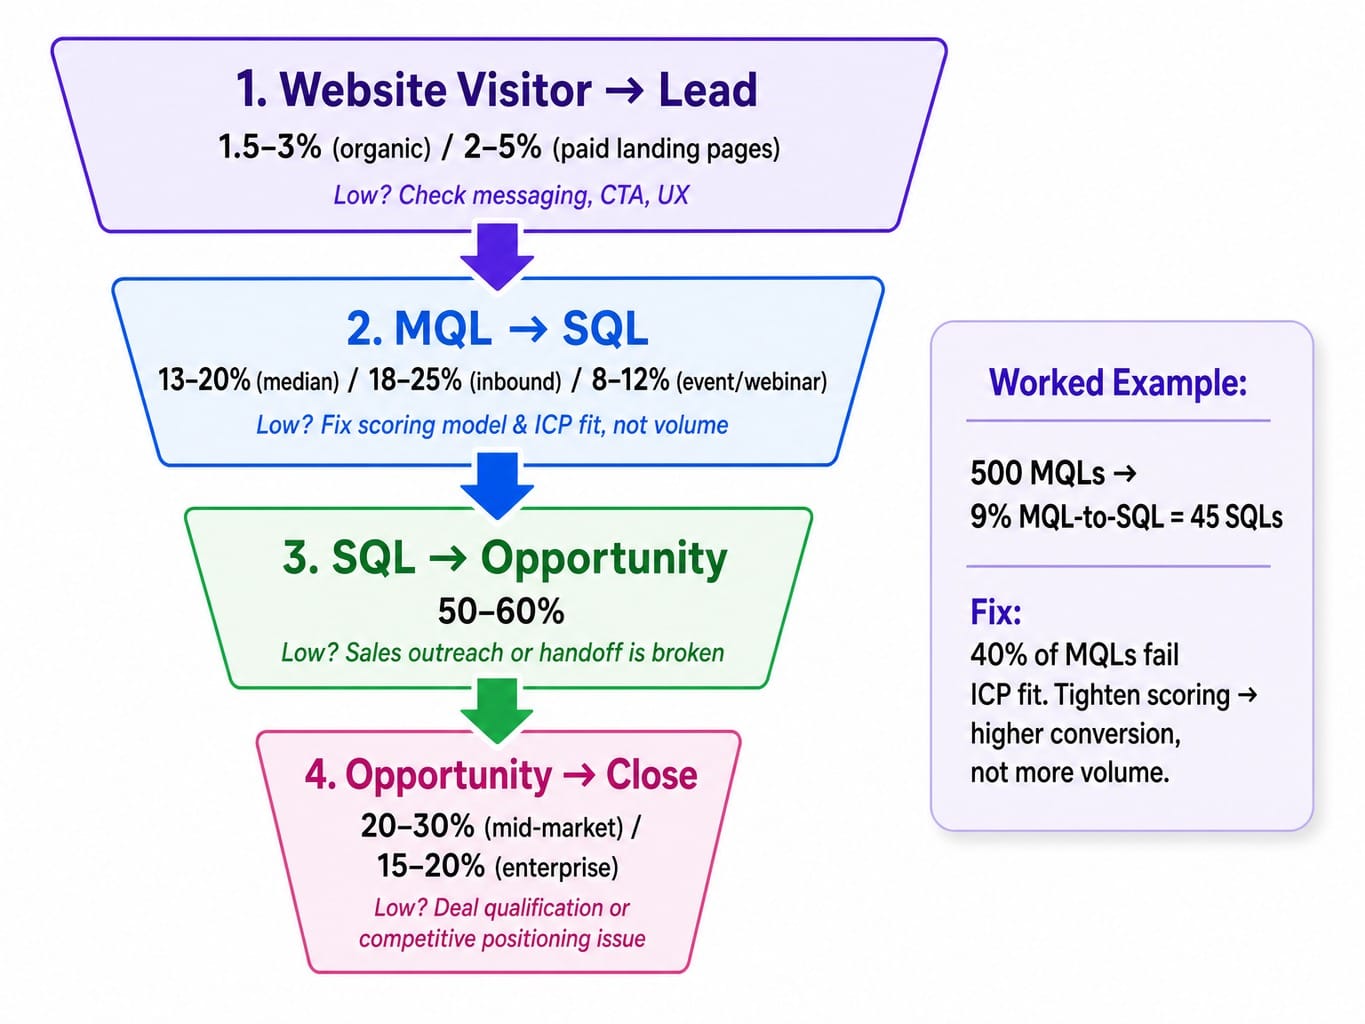
- Website Visitor-to-Lead Rate: For B2B SaaS, a typical conversion rate from organic traffic to a lead (e.g., content download, demo request) is 1.5-3%. For dedicated paid search landing pages, the expectation is higher, around 2-5%. If you're below this, the friction is likely on-page: unclear messaging, a weak call-to-action, or a poor user experience.
- MQL-to-SQL Rate: The industry median hovers around 13-20%, but this is another metric that's useless without segmentation. Conversion varies dramatically by lead source: inbound content leads might convert at 18-25%, while webinar or event leads are closer to 8-12%. A low aggregate rate often isn't a lead quality problem; it's a scoring model problem. If a high percentage of your MQLs don't match your ICP, the fix is tightening your scoring, not just generating more volume. A key intermediate metric is the SAL acceptance rate—if sales rejects a high number of MQLs, your marketing and sales definitions are not aligned.
- SQL-to-Opportunity Rate: Once a lead is accepted by sales, a healthy conversion rate to a qualified opportunity (e.g., pipeline stage 2) is 50-60%. A significant drop-off here suggests that sales outreach is ineffective or that the handoff process is broken.
- Opportunity-to-Close Rate: For mid-market deals, a win rate of 20-30% from a qualified opportunity is standard. For enterprise deals with more stakeholders and complexity, this drops to 15-20%.
Imagine a team generating 500 MQLs per month with a 9% MQL-to-SQL rate. The initial impulse is to generate more MQLs. But upon inspection, they discover 40% of their MQLs fail basic ICP fit criteria. Fixing the lead scoring model to filter out bad-fit leads is far higher leverage than pouring more budget into top-of-funnel channels. Knowing the benchmarks is one thing; having the execution system to ship fixes like landing page updates or scoring model adjustments is what separates teams that grow from those that stagnate.
Read more: Data-Driven CRO Strategies: Identifying Marketing Opportunities for True Conversion Optimization
Efficiency Metrics Investors and Boards Actually Use
Marketing teams often report on activity: leads generated, campaigns launched, content published. Your CFO and board, however, are evaluating efficiency: the direct relationship between marketing spend and revenue outcomes. This disconnect can create a credibility gap. In the current efficiency era, three metrics matter more than all others.
Pipe-to-Spend Ratio: The Metric That Determines Your Budget
The pipe-to-spend ratio is the single most important efficiency metric for a marketing leader. It answers the one question finance always asks: for every dollar we give you, how many dollars of pipeline do you create? It's calculated by dividing the total qualified pipeline generated in a period by the total marketing spend.
- Benchmarks: A ratio of 5-8x is considered healthy for most B2B SaaS companies. A ratio of 10x+ indicates exceptional efficiency. A ratio below 3x signals a structural problem in your marketing engine.
The critical caveat is that this metric is only as good as your pipeline qualification. Inflated pipeline from loose MQL definitions or a weak SAL acceptance rate can make the ratio look healthy while masking a conversion disaster downstream. For later-stage companies, this metric evolves into the "Magic Number" (net new ARR / previous quarter's S&M spend), which measures revenue efficiency.
CAC Payback and LTV:CAC: What 'Good' Looks Like by Stage
CAC Payback Period and the LTV:CAC ratio must be interpreted relative to company stage and NRR. A 24-month payback period might be a death sentence for a seed-stage startup but acceptable for a growth-stage company with high net revenue retention.
- Seed/Series A: Target a CAC payback of under 12 months and an LTV:CAC ratio of at least 3:1. This demonstrates a viable economic model early on.
- Series B/C: A payback period of 12-18 months can be acceptable, especially if NRR is strong (110%+), as expansion revenue will accelerate the payback.
- Growth Stage & LTV:CAC: An LTV:CAC ratio above 5:1 is not a sign of hyper-efficiency. It's a signal of under-investment. It means you have room to spend more aggressively on acquisition to capture market share. And let's be honest, that's a much better problem to have than the alternative. Leaving growth on the table because you're too focused on an artificially high efficiency ratio is a common but avoidable mistake.
Channel-Level Spend and Performance Benchmarks for SaaS
Knowing your overall CAC is insufficient. You need to understand which channels are efficient and which are being subsidized by the others. This requires looking at channel-level spend and performance.
- Marketing Spend as % of ARR: According to SaaS Capital's 2026 survey data, the median marketing spend for private B2B SaaS companies is around 8% of ARR. However, this varies by stage. Early-stage companies investing in brand and market presence often spend 15-20%, while more mature, profitable companies may spend less.
- Cost Per Lead (CPL) by Channel: These figures vary widely based on ACV and industry, but general B2B SaaS benchmarks are:
Organic/SEO: $50 - $100
Paid Social (LinkedIn): $100 - $200
Paid Search (Google Ads): $150 - $300
Events/Webinars: $300 - $500+
- Organic Traffic Growth Rate: For a mature SaaS blog with a consistent publishing cadence, a 15-25% year-over-year growth rate is a healthy benchmark. Early-stage companies building from a low base can and should aim for 40-60% YoY growth or more.
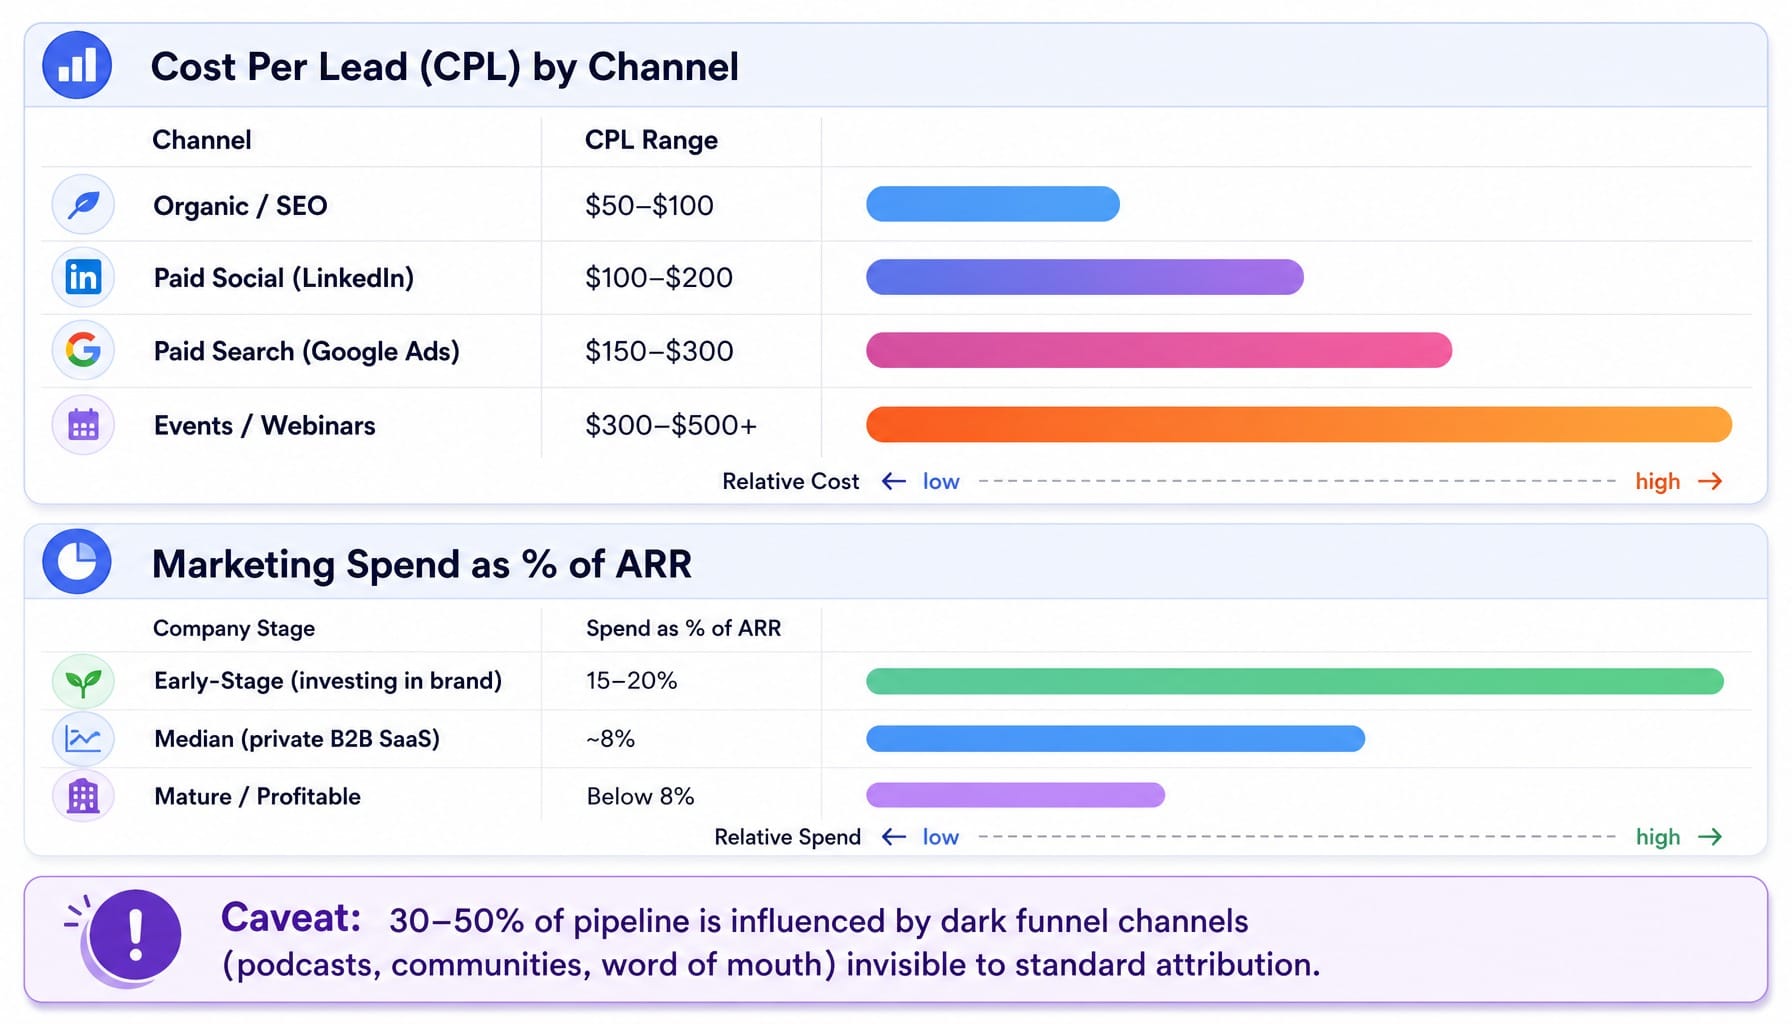
A crucial caveat: these CPL numbers are flawed. They systematically overvalue easily measurable channels (like paid search) and undervalue the dark funnel. Self-reported attribution data from tools like HockeyStack consistently shows that 30-50% of pipeline is influenced by channels that don't show up in standard attribution models—podcasts, communities, word of mouth, and social content consumption. Your highest-value customers often discover you in these unmeasurable places and then Google your brand name, making paid search look far more effective than it actually is.
Read more: Marketing Channel Prioritization for 2026: Where Your Budget Actually Compounds
How the Efficiency Era Invalidated Pre-2023 Benchmarks
Any benchmark data from 2021 or earlier belongs to a different economic regime. The market's shift from "growth-at-all-costs" (2019-2021) to the "efficiency era" (2023-present) has fundamentally changed what "good" looks like for nearly every SaaS marketing metric.
The old playbook of raising massive rounds to fund inefficient growth is over. Today, investors use frameworks like the Rule of 40 (where growth rate + profit margin should exceed 40%) to determine if growth is sustainable. This shift has reset expectations across the board:
- CAC Payback: Acceptable periods have compressed from 18-24 months to a strict under-12-to-18-month window.
- Headcount Efficiency: Marketing headcount per $1M in ARR has dropped as lean teams are expected to achieve more with less.
- Pipeline Quality: Inflated pipeline is no longer tolerated. Pipeline coverage ratios have tightened, and scrutiny on conversion rates has intensified.
- NRR as King: Net Revenue Retention has become the single most important metric separating fundable companies from unfundable ones, as it demonstrates durable, efficient growth.
Adding another layer of complexity is the rise of AI-powered SDR tools. Outbound sequences built with tools like Clay are generating higher volumes of meetings at a lower cost, which is beginning to distort top-of-funnel benchmarks. Teams comparing their 2026 performance against older data may be competing against an artificially inflated baseline. Benchmarks are not permanent truths; they are snapshots of a specific economic and technological moment.
When You Know the Benchmarks but Can't Close the Gap
This is the core tension for every lean marketing team. You now have the benchmarks. You can see the gap between your 9% MQL-to-SQL rate and the 18% target for your inbound channel. You know you need to rewrite landing pages, adjust scoring models, and experiment with new CTAs.
But knowing is not doing.
The real constraint isn't a lack of strategy; it's an execution gap. The latency between identifying a problem and shipping a fix—through planning, approvals, and fragmented toolsets—eats weeks. Your backlog of benchmark-informed improvements grows, but your core metrics don't move. Teams with limited budget and resources feel this tension most acutely.
This is where an execution system becomes critical. Spike AI is designed to close that gap. Instead of just identifying the highest-impact move across your website, SEO, or conversion funnel, it executes it. Every week.
The compounding effect of weekly releases means benchmark gaps close through consistent execution, not heroic quarterly pushes. The team that ships three conversion improvements this month will always outperform the team that spent the month building the perfect dashboard. Spike AI is the system that turns "we know our conversion rate is low" into "we shipped three conversion improvements this month and measured the impact."
See how Spike AI turns your marketing backlog into weekly shipped improvements
Conclusion
Benchmarks are diagnostic instruments, not targets. Their value is determined entirely by whether you have the execution capacity to act on what they reveal.
Unsegmented data misleads. The right benchmarks for your SaaS depend on your GTM motion, your company stage, and the current efficiency-focused climate. But even with perfect data, the gap between knowing your numbers and improving them remains an execution problem.
The SaaS teams that outperform their benchmarks in 2026 and beyond won't be the ones with the most sophisticated dashboards. They will be the ones with the fastest and most consistent execution cycles. They will be the ones that ship.
Frequently Asked Questions
What is a good CAC payback period for a B2B SaaS company in 2026?
The benchmark depends on your stage. Seed to Series A companies should target under 12 months. Series B can tolerate 12-18 months if NRR exceeds 110%. Post-2023 investor expectations have compressed acceptable payback periods by roughly 30%, making rapid payback more critical than ever for demonstrating capital efficiency.
How should I benchmark marketing-influenced revenue versus marketing-sourced revenue?
Marketing-sourced revenue includes only deals where marketing generated the initial lead. Marketing-influenced includes any deal marketing touched. Top-performing SaaS companies typically see 40-60% marketing-sourced pipeline and 70-85% marketing-influenced pipeline. Conflating the two overstates marketing's direct contribution and can create misalignment with sales leadership who track sourced pipeline.
What pipeline coverage ratio do top-performing SaaS companies maintain?
A healthy pipeline coverage ratio (total qualified pipeline / revenue target) is 3-4x for mid-market SaaS and 4-5x for enterprise. A ratio above 5x isn't necessarily better; it often indicates a pipeline quality problem where teams generate excess volume to compensate for low win rates, rather than improving upstream qualification.
How do SaaS marketing benchmarks differ between SMB and enterprise segments?
SMB-focused SaaS has lower CAC ($100-$400), shorter deal cycles (14-30 days), and lower NRR (95-105%). Enterprise SaaS has higher CAC ($2,000-$8,000+), longer cycles (90-180 days), and higher NRR (110-130%). The core difference in the model is that SMB businesses must compensate for structurally higher churn with much lower acquisition costs and faster payback periods.
What is the 3-3-2-2-2 rule of SaaS and does it still apply?
This rule describes a hyper-growth trajectory: triple revenue twice, then double it three times (e.g., $1M → $3M → $9M → $18M…). It originated in the growth-at-all-costs era, fueled by abundant capital. In today's efficiency-focused market, it's less relevant. The Rule of 40 (growth rate + profit margin ≥ 40%) is now the more critical framework for evaluating if growth is sustainable and capital-efficient.