What Is a Good SaaS Free Trial Conversion Rate? 2026 Data, Segmented Benchmarks, and the Metrics That Matter
TLDR
- The average SaaS free trial conversion rate is a misleading metric. Benchmarks range from 3% for freemium to 60% for opt-out trials, so your specific trial model and ACV tier determine your actual target.
- The highest-leverage way to improve trial conversion is to increase your activation rate—the percentage of users who reach their "aha moment." Your overall conversion is simply a byproduct of how many users you successfully activate.
- Stop benchmarking against aggregate averages. Instead, benchmark against the 75th percentile for your specific model (e.g., 25-30% for an opt-in trial on a ~$2K ACV product).
- The 14-day trial is becoming obsolete. The optimal trial length is your product's time-to-first-value (TTFV) plus 2-3 days, with a trend towards dynamic trial lengths personalized by user engagement.
- A good demo-to-close rate is 20-30%, but this measures a sales-assisted motion and is not comparable to self-serve trial conversion rates. Reducing demo no-shows often has a higher ROI than improving the close rate itself.
The SaaS free trial conversion rate ranges from 3% to over 60% depending on your trial model, credit card policy, and annual contract value (ACV). Any article that gives you a single 'average' is setting a target that applies to almost nobody.
The often-cited median from ChartMogul's 2026 data is around 8%, but this number is a statistical artifact. It blends high-volume, low-conversion freemium models with low-volume, high-conversion opt-out trials, creating a median that is actively misleading for any individual team. It's like citing the "average vehicle speed" without distinguishing between a highway and a parking lot.
This guide provides the segmented benchmarks that actually apply to your model. We'll break down why aggregate numbers lead teams to the wrong optimization playbook and walk through a step-by-step process for measuring and improving the trial-to-paid conversion rate that truly matters for your business.
2026 SaaS Free Trial Conversion Rate Benchmarks by Trial Model
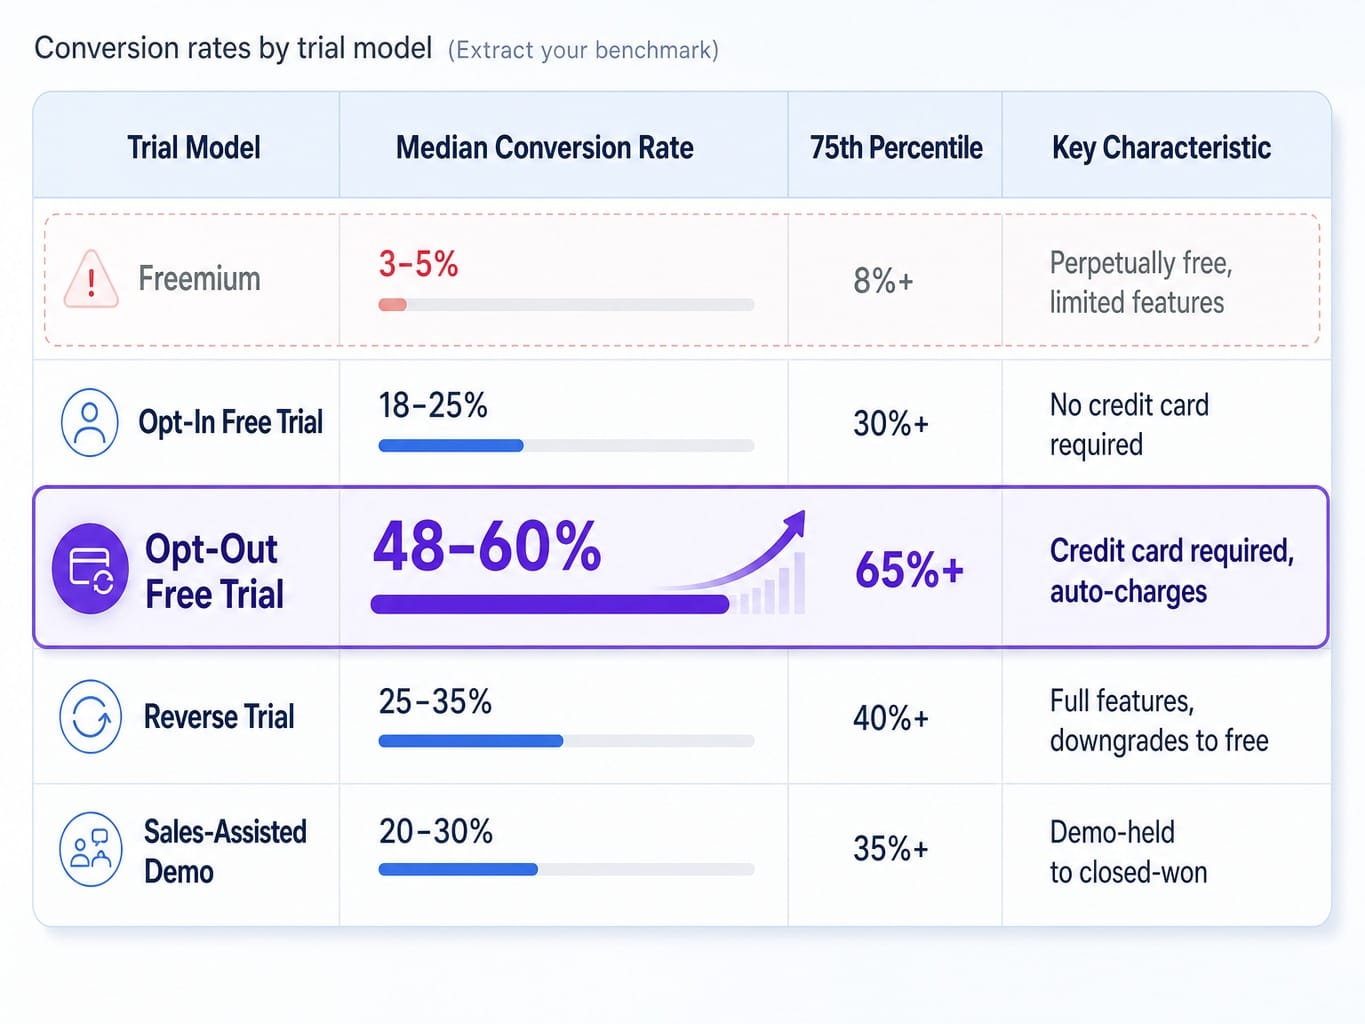
The average SaaS free trial to paid conversion rate in 2026 ranges from 3–5% for freemium models to 48–60% for opt-out trials requiring a credit card, with opt-in free trials falling between 18% and 25% at the median. The specific model you use is the single biggest factor influencing your target rate.
Here's how the benchmarks break down by the most common acquisition motions:
But these numbers, presented in isolation, are more dangerous than useful. The spread between 3% and 60% isn't noise; it reflects fundamentally different business models with different unit economics. A freemium model at 3% conversion can vastly outperform a free trial at 25% if its signup volume is 10x higher.
Consider this thought experiment:
- Freemium: 1,000 visitors → 40% signup rate (400 users) → 3% conversion = 12 paying customers.
- Opt-In Trial: 1,000 visitors → 10% signup rate (100 users) → 25% conversion = 25 paying customers.
- Opt-Out Trial: 1,000 visitors → 8% signup rate (80 users) → 55% conversion = 44 paying customers.
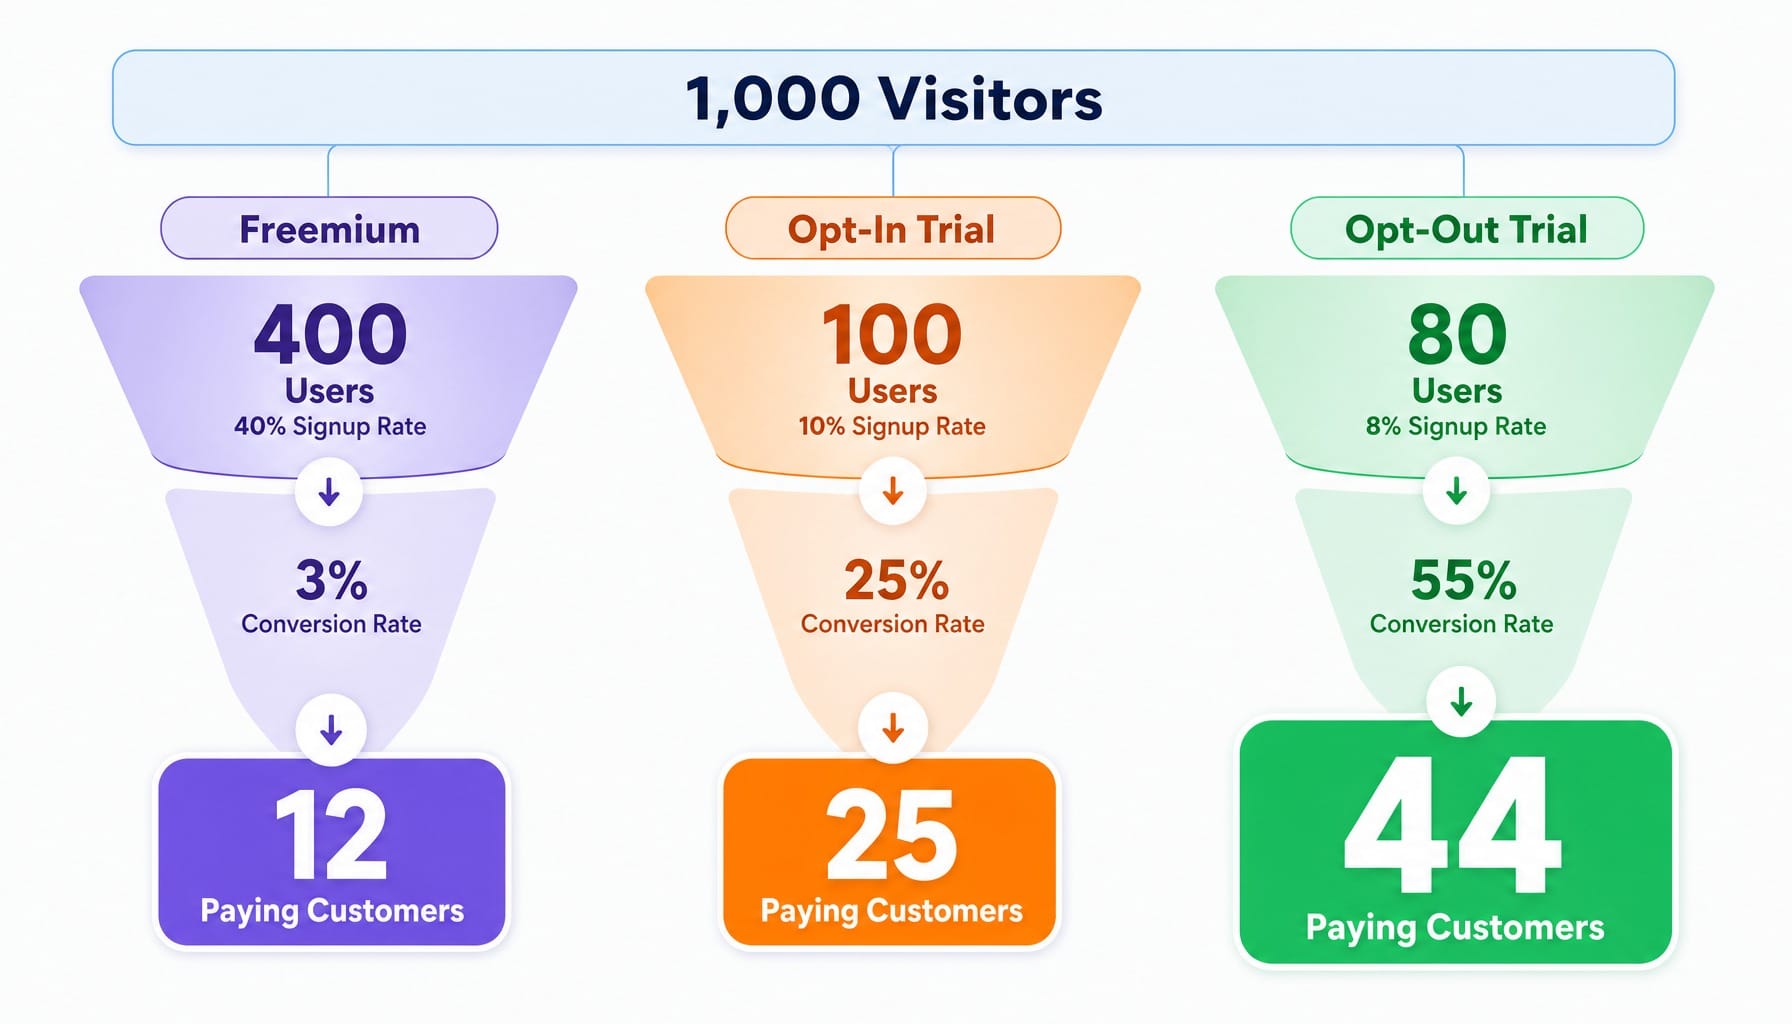
The conversion rate alone tells you nothing about which model wins without also knowing the trial signup rate, customer acquisition cost (CAC), and lifetime value (LTV).
Conversion Rates Segmented by ACV Tier
Your Annual Contract Value (ACV) changes the conversion playbook more than the trial model does. High-ACV products attract more intentional buyers who have already done their research, while low-ACV products attract more casual browsers.
According to a 2026 ProductLed survey of over 600 SaaS companies, the difference is stark:
- Sub-$1k ACV: 9–15% average trial conversion rate.
- $1k–$5k ACV: 30–39% average trial conversion rate.
Why the gap? Higher-ACV products almost always involve some form of sales-assisted touchpoint, even in a product-led growth (PLG) motion. A warm handoff from the product to a sales rep for a user who hits a PQL threshold can dramatically lift conversion. Comparing your 12% conversion rate for a $99/month tool against a benchmark derived from $5k+ ACV products is comparing apples to freight trucks.
Industry-Specific Benchmarks Worth Knowing
While your trial model and ACV are the primary drivers, industry benchmarks provide some useful context. Based on 2026 data from First Page Sage, here are a few industry-specific medians for opt-in trials:
- CRM: 29%
- Edtech: 24.8%
- IoT: 25.2%
- Cybersecurity: 21.9%
- Healthcare: 21.5%
- Enterprise SaaS (General): 18.6%
The key takeaway here is that the variance across industries is much smaller than the variance across trial models. How you structure your trial matters far more than the vertical you sell into.
Why Aggregate Benchmarks Lead Teams to the Wrong Optimization Playbook
Focusing on a single, aggregate benchmark number is one of the fastest ways to waste a quarter.
Consider this common scenario: a B2B SaaS team with a no-credit-card, 14-day trial sees their 15% conversion rate. They panic, because they read somewhere that the "average" is 25%. They launch a project to add a credit card gate. The change works—their trial-to-paid conversion rate jumps to 40%. But it also cuts their total trial signups by 70%. The net result is fewer paying customers and a higher CAC.
The team optimized for a benchmark that didn't apply to their model and, in doing so, damaged their acquisition funnel.
This happens because SaaS trial conversion rates don't follow a normal bell curve. ChartMogul's own data shows a bimodal distribution: rates cluster at two poles, one below 10% (driven by freemium and low-intent trials) and another above 40% (driven by opt-out and sales-assisted motions). The median is a statistical ghost floating in the middle, representing no one.
The right benchmark is not "what is the average for SaaS?" The right benchmark is "what is the 75th percentile for my specific trial model, ACV tier, and sales motion?"
- If you run an opt-in trial for a $2k ACV product, your benchmark is 25–30%, not 8%.
- If you run a freemium model for a $50/month tool, your benchmark is 4–6%, and that might be world-class.
Stop benchmarking against the average. Start benchmarking against your model's ceiling.
How Credit Card Requirements Change Free Trial Conversion Math
Requiring a credit card upfront increases free trial conversion rates to 48–60% (vs. 18–25% for no-card trials) but reduces trial signup volume by 50–80%, according to 2026 data from First Page Sage and ProductLed.
The mechanism is simple: a credit card gate is a filter. It screens out casual browsers and tire-kickers, leaving a denominator of only high-intent users. The conversion rate rises not because the product experience improved, but because the pool of trial users shrank to only the most committed.
The decision framework is a direct tradeoff between volume and qualification:
- Opt-Out (CC Required): Works best when your product delivers obvious value within the first 1-2 sessions (a short time-to-first-value), and your ACV can support the higher CAC that comes from acquiring fewer, more qualified trial users. Think of services like Ahrefs or Netflix.
- Opt-In (No CC): Works best when your product requires exploration to understand its value, your ACV is lower, and your model relies on high top-of-funnel volume to find pockets of intent. This is the default for most B2B SaaS.
The common failure mode is adding a credit card gate to "improve conversion rates" without modeling the impact on total new customers. A simple rule of thumb: if your current no-credit-card trial converts above 20%, adding a CC gate will likely reduce your total number of new customers.
How Trial Length Affects Conversion—and Why the 14-Day Default Is Losing Ground
The optimal SaaS free trial length depends on your product's time-to-first-value (TTFV), not convention. The 14-day default is increasingly being replaced by 7-day trials for simple products and dynamic trial lengths personalized by user behavior.
Why? Cohort analyses from firms like Amplitude consistently show that the vast majority of users who convert to paid do so within the first 3-5 days of their trial. The remaining 9-11 days of a standard 14-day trial are often dead time. This is where the trial decay curve kicks in—the percentage of users who simply stop logging in, reducing urgency without improving activation. For many products, a 14-day trial is just a 3-day trial with 11 days of procrastination.
An emerging trend for 2026 is the dynamic trial. Using in-app messaging tools like Intercom or Appcues, you can trigger automated trial extensions for users who are showing strong engagement signals (like return visits or feature adoption) but haven't hit their "aha moment" yet. Conversely, you can prompt users who have hit activation milestones to upgrade early.
A practical rule of thumb: measure your activation curve—the day by which 80% of your converting users have completed their key activation milestone. Set your trial length to be that day plus two. If 80% of your converters activate by day 5, your trial should be 7 days, not 14.
How to Measure and Improve Your Trial-to-Paid Conversion Rate: A Step-by-Step Process
Most teams track trial conversion as a single number (trials started ÷ paid conversions). This is a vanity metric. It tells you what your rate is, but not why. To actually improve it, you need to decompose the funnel. Product-led companies that define and track product-qualified leads (PQLs) convert at 25%, compared to the 9% average for those who don't. The difference is this process.
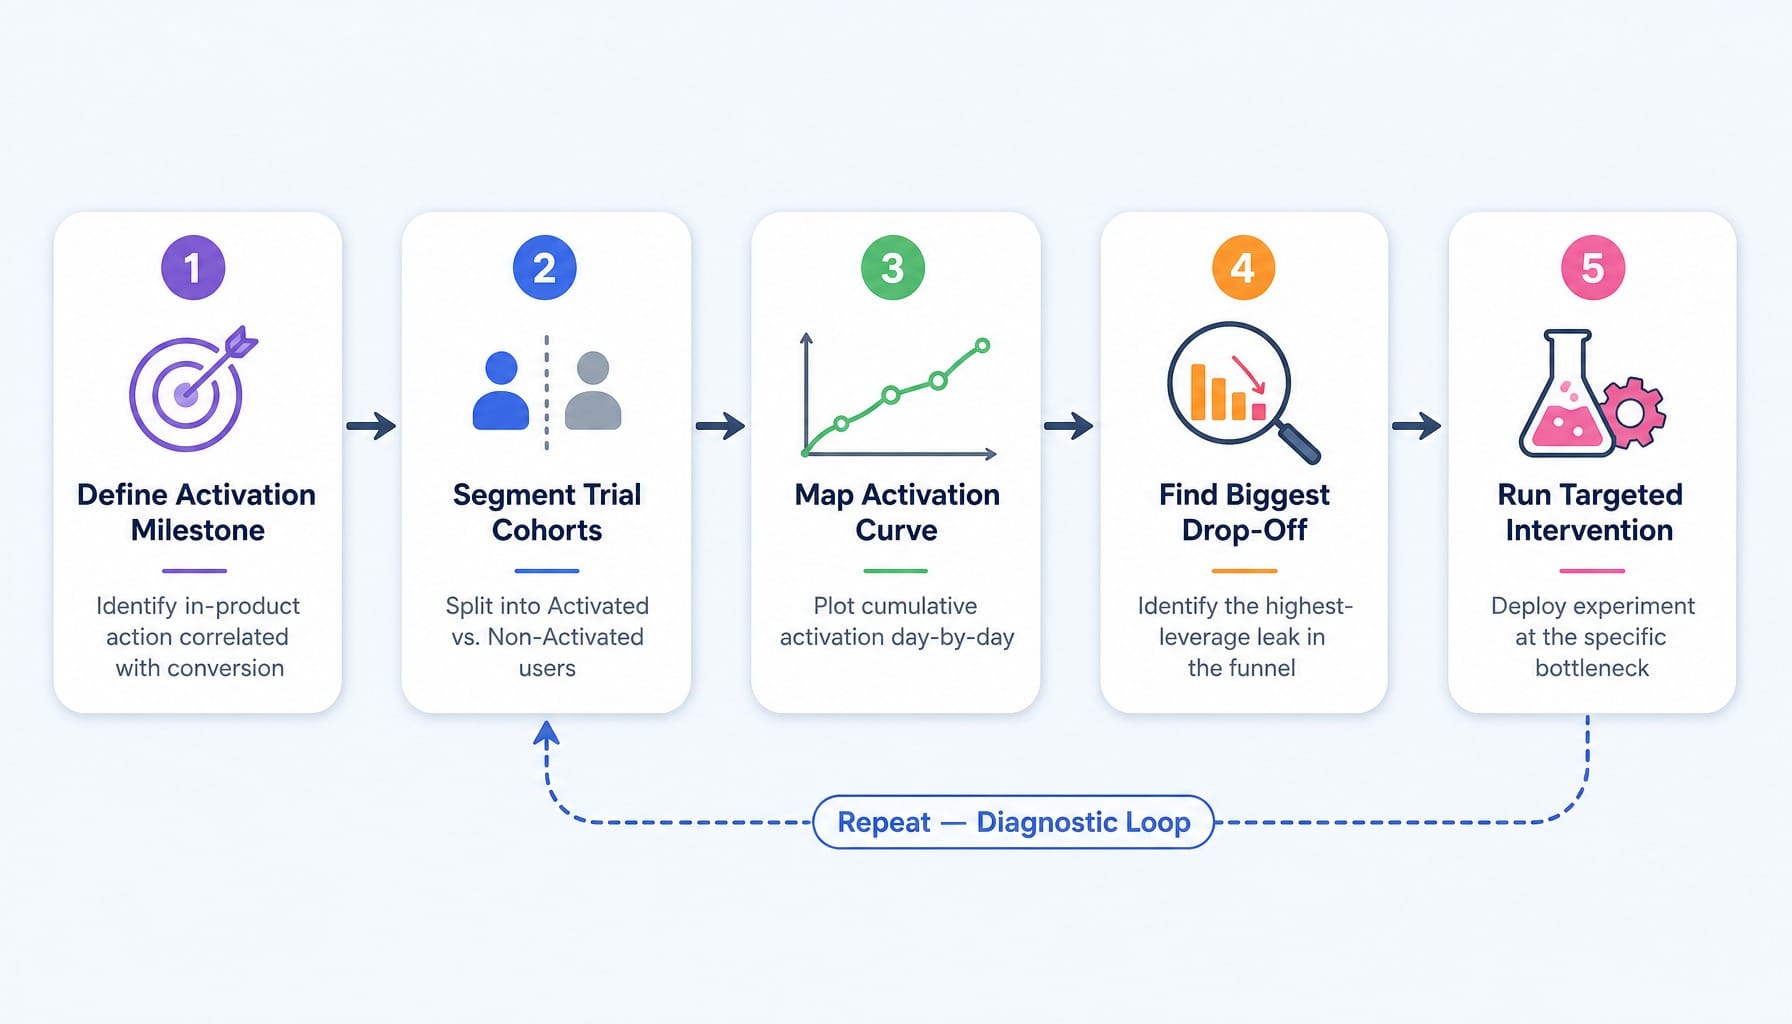
Here are the five steps to create a repeatable diagnostic loop.
Step 1: Define Your Activation Milestone
- Action: Identify the specific, measurable in-product action(s) that correlate most strongly with a user converting to paid. This is your "aha moment." It could be 'created first dashboard,' 'invited a team member,' or 'ran first report.' Use a product analytics tool like Amplitude, Mixpanel, or Heap to run a correlation analysis between feature usage events and conversion events.
- Outcome: You now have a concrete definition of an "activated user," not just a guess.
Step 2: Segment Trial Users into Cohorts
- Action: Separate all trial users into two buckets: 'Activated' and 'Non-Activated.' Calculate the conversion rate for each cohort independently.
- Outcome: You can now see the truth. Your "overall" 15% conversion rate might actually be 45% for activated users and a mere 3% for non-activated users. This instantly reveals your problem isn't pricing or product-market fit—it's activation.
Step 3: Map the Activation Curve
- Action: Plot the cumulative percentage of new trial users who reach your activation milestone, day by day, for the first 14 days of their trial.
- Outcome: You now have a visual representation of your product's TTFV. You can see exactly when users are getting value and, more importantly, when they are dropping off.
Step 4: Identify the Highest-Leverage Drop-Off Point & Diagnose Why
- Action: Look at your activation funnel. Where is the biggest leak? Is it between signup and first login? Between first login and first key action? Use a tool like Pocus or Vitally to identify "red zone" users—those who signed up but haven't completed any activation milestones within 48 hours.
- Outcome: You have a specific bottleneck to attack. This is the critical diagnostic step most teams skip. They jump to "let's send more onboarding emails," which treats the symptom, not the cause.
Step 5: Run a Targeted Intervention
- Action: Design an experiment that targets the specific bottleneck you identified. If 60% of non-activated users drop off before creating their first project, test a personalized in-app walkthrough using a tool like Chameleon or Appcues that guides them to that action within their first session.
- Outcome: A repeatable diagnostic loop. You measure the change in activation rate for the cohort that received the intervention, and the overall trial conversion rate follows.
Read more: Pipeline Marketing in 2026: Strategy, Metrics, and Why Most Teams Regress to Lead Gen
When the Bottleneck Is Bandwidth, Not Benchmarks
The process above is straightforward. Intellectually, every lean marketing team knows this is what they should be doing. The problem is that running this diagnostic loop consistently is a massive drain on resources. Each cycle requires coordinating product, marketing, and sometimes engineering. The latency between identifying a drop-off in Mixpanel and shipping a fix with an in-app guide or a new onboarding email can stretch into weeks, or even a full quarter. The backlog grows, but the shipping cadence doesn't.
This is the execution gap Spike AI is built to close.
Spike AI functions as a continuous optimization system for your funnel. It identifies the highest-impact conversion constraint across your website and onboarding flow, models the impact of a fix, and then deploys the change. This isn't a quarterly project; it's a weekly release cadence. Instead of diagnosing a problem and handing you a report, Spike AI ships the solution—turning the five-step process above from a manual chore into a system that's always running.
See how Spike AI identifies and ships your highest-impact conversion fix every week
The Common Way This Goes Wrong: Optimizing the Wrong Layer
The most common mistake teams make is optimizing the conversion prompt (the pricing page, the upgrade modal, the timing of the "your trial is ending" email) when the real constraint is activation.
Here's the diagnostic:
- If your activated-user conversion rate is above 35%, your value proposition and pricing are likely fine. Your problem is upstream: not enough users are reaching activation in the first place. Your focus should be on onboarding.
- If your activated-user conversion rate is below 20%, you have a value communication or pricing problem. Even your most engaged users aren't converting. Your focus should be on positioning, packaging, and pricing.
The telltale sign of a team optimizing the wrong layer? They've run five A/B tests on their upgrade email subject lines, while their day-zero engagement rate—the percentage of trial users who complete one meaningful action on signup day—is stuck below 40%.
Worked Example: From 17.8% to 25.4% Trial Conversion in 3 Weeks
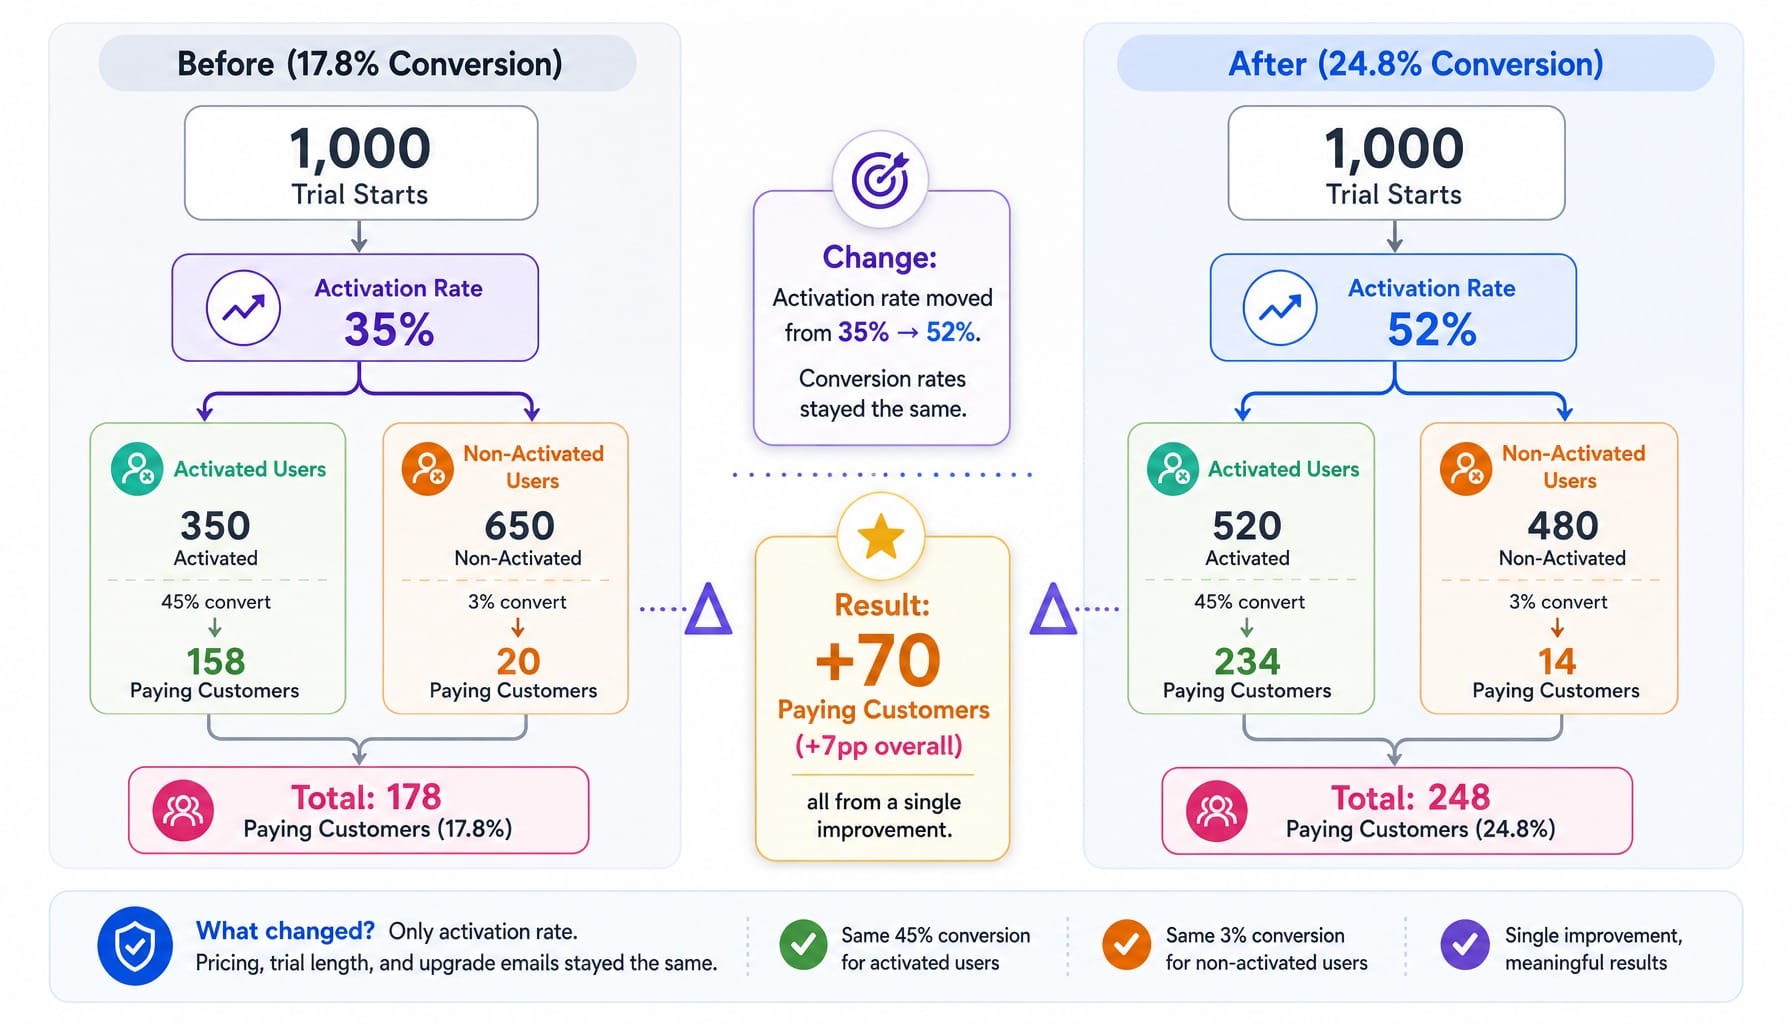
Let's walk through the math. A SaaS company has the following funnel:
- Inputs:
1,000 trial starts per month.
Activation Rate: 35% (350 users reach the activation milestone).
Conversion Rate (Activated): 45% (350 \ 0.45 = 158 paying customers).
Conversion Rate (Non-Activated): 3% (650 \ 0.03 = 20 paying customers).
- Initial Result:
Total Paying Customers: 158 + 20 = 178.
Overall Conversion Rate: 17.8% (178 / 1,000).
The team identifies that most non-activated users never complete the first key action: creating a project. They deploy a simple, guided in-app walkthrough targeting that specific action.
- New Inputs:
New Activation Rate: 52% (520 users).
Conversion Rate (Activated): 45% (520 \ 0.45 = 234 paying customers).
Conversion Rate (Non-Activated): 3% (480 \ 0.03 = 14 paying customers).
- Final Result:
Total Paying Customers: 234 + 14 = 248.
New Overall Conversion Rate: 24.8% (248 / 1,000).
The team never touched pricing, never changed the trial length, and never redesigned the upgrade email. They moved one upstream metric—activation—and the downstream conversion rate followed.
SaaS Demo Conversion Rate Benchmarks: How Demo-Led Differs from Trial-Led
A good SaaS demo-to-close conversion rate is 20–30% for top-performing teams, with the median hovering around 15%, according to 2026 analysis from Gong.
It's critical to distinguish this from trial conversion. A demo conversion rate measures a sales-assisted motion where a human qualifies the lead before the product is shown. A trial conversion rate measures a self-serve motion where the product itself does the qualification. Comparing the two is meaningless without accounting for this fundamental difference in qualification.
Furthermore, a 25% demo-to-close rate is a vanity metric without context on pipeline velocity. If the sales cycle is 90 days and the demo no-show rate is 40%, the funnel is less healthy than it appears. Data from platforms like Chilipiper shows the average demo no-show rate is 20-30%. For many teams, reducing no-shows by 10 points (e.g., through better scheduling tools or automated reminders) has the same revenue impact as improving the close rate by 5 points, but is far easier to achieve.
Increasingly, the line is blurring. The fastest-growing companies use a hybrid PLG-sales motion, leveraging interactive demos from tools like Navattic or Reprise to qualify users at the top of the funnel before routing high-intent hand-raisers to a live sales demo.
Read more: B2B Marketing Funnel: Why Most Stall and How to Build One That Ships
Your Conversion Rate Is a Reflection of Your System
The SaaS free trial conversion rate that matters is not the aggregate average you read in a blog post. It's your rate, segmented by trial model, ACV tier, and most importantly, activation status.
The teams that consistently improve this number are not the ones chasing benchmark parity. They are the ones running a continuous loop of activation measurement, drop-off diagnosis, and targeted intervention.
The 2026 landscape is shifting toward dynamic trials, AI-driven onboarding, and PLG-sales hybrid motions. Teams still measuring "overall trial conversion rate" as a single, monolithic number are optimizing a metric that no longer accurately describes their business. The imperative is clear: stop comparing your number to the average and start decomposing it into the layers you can actually move.
Frequently Asked Questions
What is the difference between opt-in and opt-out free trial models?
An opt-in trial lets users sign up without payment info, converting at 18–25% with high volume. An opt-out trial requires a credit card and auto-renews, converting at 48–60% with much lower signup volume. The right choice depends on your product's time-to-value and whether it delivers clear value before the trial ends.
How do reverse trials impact conversion rates compared to traditional free trials?
A reverse trial gives users full access, then downgrades them to a free plan. Early 2026 data suggests they convert at 25–35%, often outperforming traditional opt-in trials. This works by letting users experience the full product before features are taken away, creating a stronger sense of loss aversion than a standard upgrade prompt.
How do you calculate product-qualified leads from free trial users?
A PQL is a trial user who completes a predefined activation milestone (e.g., "invited a teammate") that strongly correlates with converting to paid. Use a product analytics tool like Amplitude or Mixpanel to identify these predictive actions, then score users against them. PQL-driven companies see conversion rates around 25%, nearly 3x the average.
How does free trial conversion rate differ between SMB and enterprise SaaS?
Enterprise SaaS trials (ACV $25k+) often have lower conversion rates (10–18%) because they involve complex, sales-assisted qualification. SMB SaaS trials ($1k–$5k ACV) can convert at 30–39% due to simpler buying decisions. Comparing these rates without accounting for ACV and sales cycle length is misleading.
What trial engagement signals best predict conversion to paid?
The strongest predictors are day-zero engagement (completing a key action on signup day), return visits within the first 72 hours, and reaching the activation milestone before the trial's midpoint. Users who don't engage within the first 48 hours almost never convert. Tools like Pocus and Vitally can score these signals automatically.
Should SaaS companies offer a free trial or a live demo to maximize conversion?
Neither is universally better; it depends on product complexity and ACV. Simple products with low ACV (<$5k) favor self-serve trials. Complex products requiring configuration or multi-stakeholder buy-in favor demos. The modern approach is a hybrid: use an interactive demo (e.g., with Navattic) to qualify users, then route them to a trial or live demo based on their engagement.