SaaS CAC: How to Calculate, Benchmark, and Fix the Metric Most Teams Get Wrong

TLDR
- Most SaaS companies miscalculate Customer Acquisition Cost (CAC) by using inconsistent definitions for "cost" and "customer," a problem that distorts the final number by 2-4x.
- Before benchmarking or optimizing, you must standardize your inputs: use a fully loaded CAC, separate blended from channel-level CAC, and account for sales rep ramp time.
- Investors prioritize the gross-margin-adjusted CAC payback period, not CAC in isolation. A healthy SaaS business should aim to recover its CAC in under 12 months.
- Comparing your CAC to industry benchmarks is dangerous unless you know what denominator and cost definition the benchmark used. Segment benchmarks by company stage and ACV for a more accurate comparison.
- The highest-leverage way to reduce CAC is to improve bottom-of-funnel conversion rates, which increases the number of customers acquired from your existing spend.
SaaS Customer Acquisition Cost (CAC) is the total sales and marketing spend required to acquire one new paying customer over a defined period. The two numbers every SaaS board member knows are the 3:1 LTV:CAC ratio target and the 12-month payback period benchmark. Anything less feels inefficient.
The formula is deceptively simple: Total S&M Costs ÷ New Customers. But in practice, every variable in that equation is a judgment call. What counts as a 'cost'? Do you include the salary for a new account executive who won't be productive for six months? What counts as a 'customer'—a free-trial conversion, a paid logo, or an expansion seat from an existing account?
Most SaaS companies report a CAC number that is internally inconsistent and externally incomparable. This isn't a math problem; it's a definition problem. This article walks through the correct calculation, shows where it breaks, provides benchmarks that account for these differences, and explains how to actually use CAC to make better spending decisions.
What Is SaaS CAC?
SaaS Customer Acquisition Cost (CAC) measures how much a software company spends on sales and marketing to convert one prospect into a paying customer. It is the single most important metric for gauging the efficiency of a go-to-market engine and the viability of its unit economics.
CAC = Total Sales & Marketing Expenses ÷ Number of New Customers Acquired
The inputs for this formula should be measured over the exact same period (e.g., a specific quarter or year).
- Total Sales & Marketing Expenses: This includes all costs associated with your acquisition efforts, such as salaries, commissions, ad spend, tooling subscriptions (CRM, marketing automation), content production costs, event sponsorships, and agency fees.
- Number of New Customers Acquired: This is the count of new, distinct paying customers who signed up during the defined period.
Crucially, CAC is not the same as Cost Per Acquisition (CPA). CPA measures the cost of a specific acquisition event, like a lead, a free trial signup, or a demo request. CAC measures the cost of acquiring a paying, revenue-generating customer. Conflating the two—which many marketing dashboards do by default—can understate your true acquisition cost by 30–60% because it counts top-of-funnel actions from leads who never convert.
How to Calculate SaaS CAC
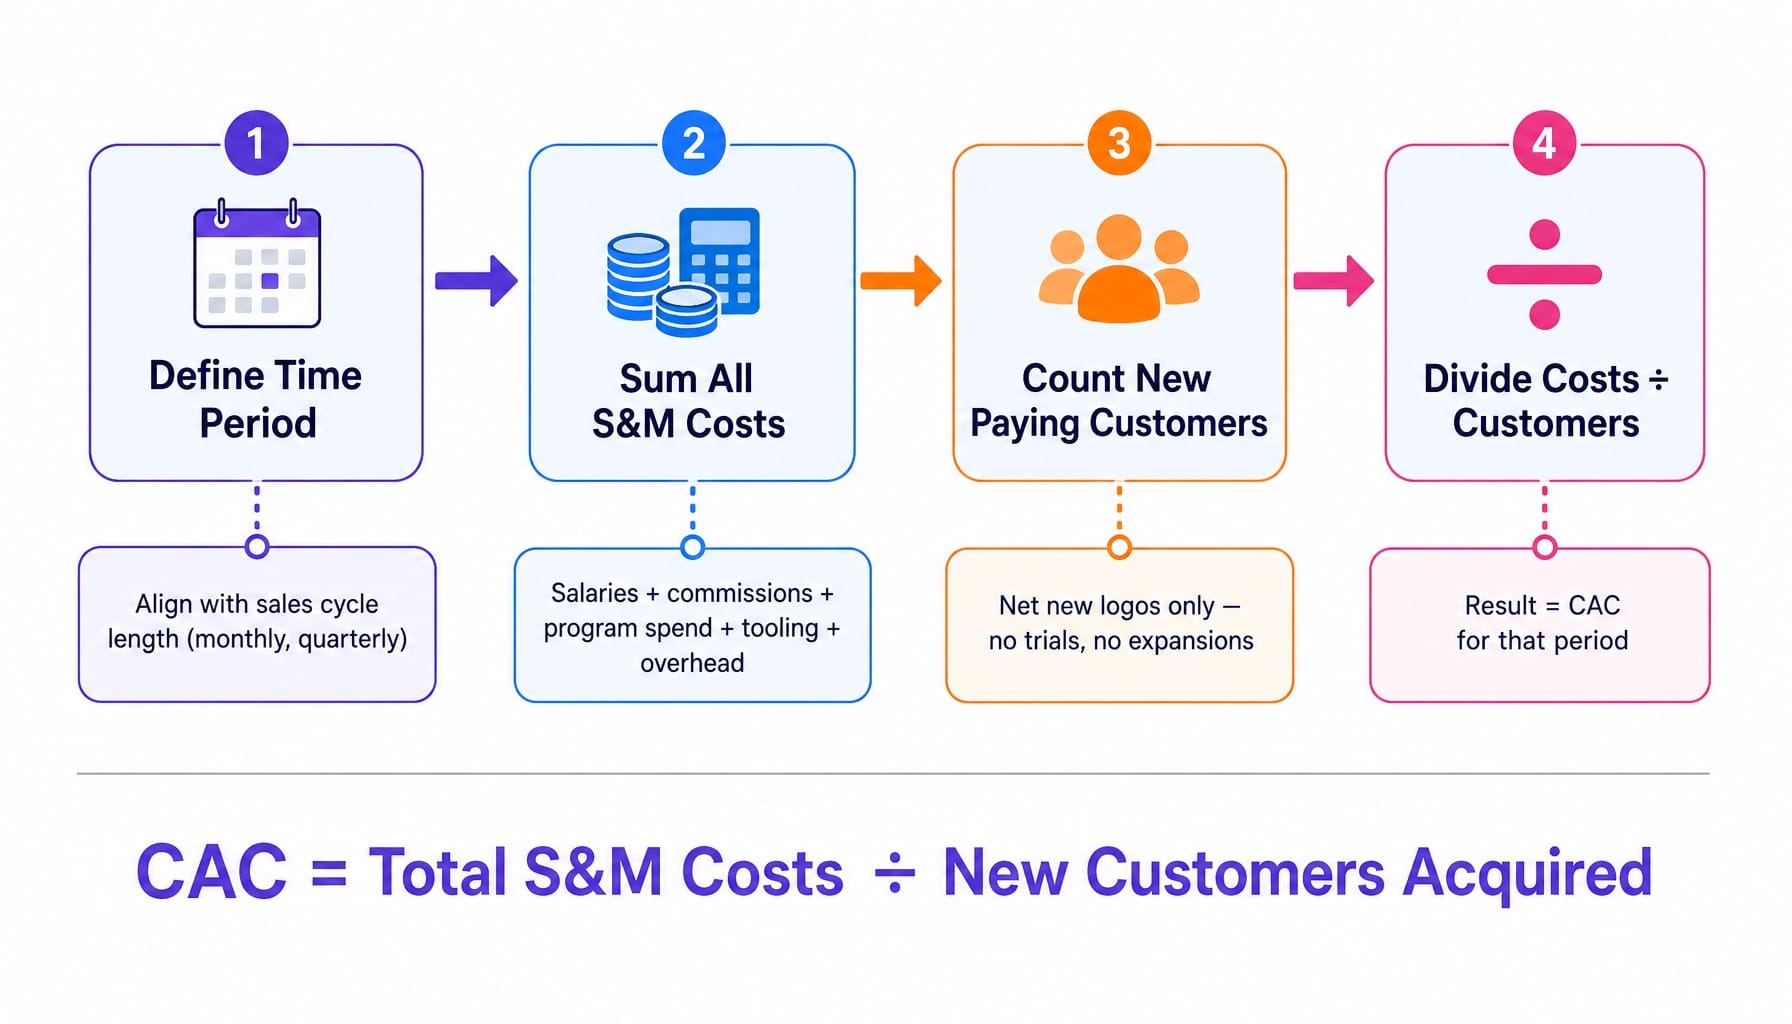
Calculating CAC is a four-step process. The math is simple; the discipline is in the inputs.
- Define the Time Period. Most SaaS companies measure CAC quarterly, as it smooths out monthly volatility. As a rule of thumb, your measurement period should align with your average sales cycle length. A 90-day enterprise sales motion needs quarterly measurement, while a 14-day PLG conversion funnel can be measured monthly.
- Sum All Sales & Marketing Costs. This is the numerator. You must be exhaustive. Include all salaries, commissions, and benefits for your S&M team. Add all program spend: ad campaigns, content production, software subscriptions (e.g., HubSpot, Salesforce, Gong), agency retainers, event costs, and travel expenses.
- Count All New Paying Customers. This is the denominator. The key here is "new" and "paying." Do not include users on a free trial, marketing qualified leads (MQLs), or expansion revenue from existing customers. This number should only reflect net new logos that started generating revenue in the defined period.
- Divide Costs by Customers. Divide the total S&M costs from Step 2 by the number of new customers from Step 3. The result is your CAC for that period.
Worked Example: Calculating CAC for a Mid-Market SaaS Company
Let's walk through a complete numerical example.
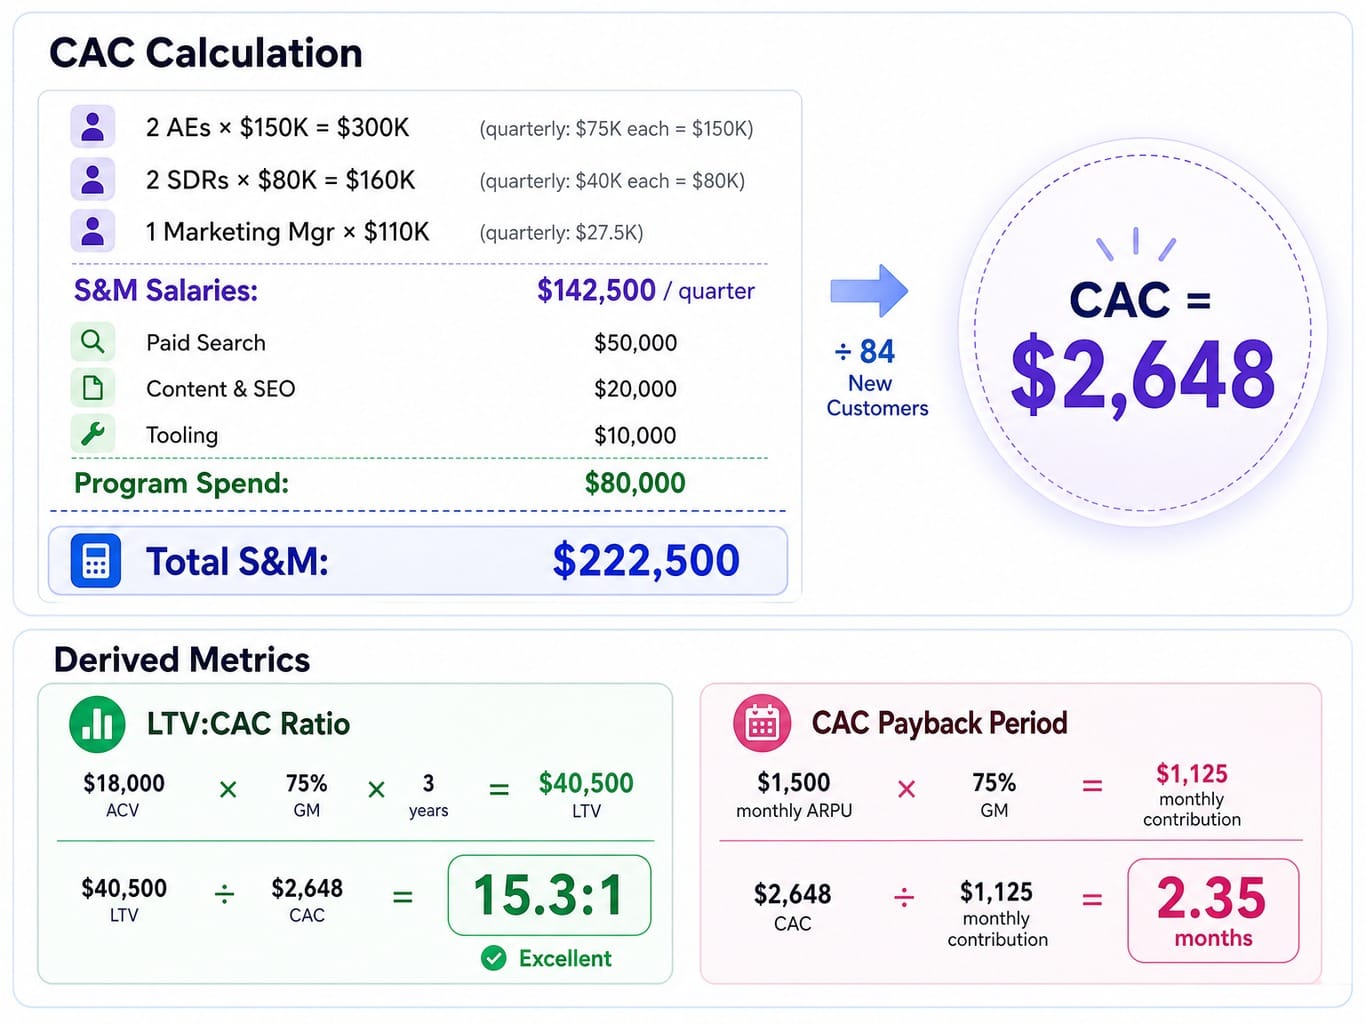
Company X has a 5-person sales and marketing team:
- 2 Account Executives ($150,000 fully loaded salary each)
- 2 Sales Development Reps ($80,000 fully loaded salary each)
- 1 Marketing Manager ($110,000 fully loaded salary)
Their quarterly program spend is:
- Paid Search: $50,000
- Content & SEO: $20,000
- Tooling (CRM, etc.): $10,000
In Q3, they closed 84 new customers.
CAC = $222,500 ÷ 84 New Customers = $2,648
Now, let's extend this to the metrics investors care about. If the company's average Annual Contract Value (ACV) is $18,000 and gross margin is 75%:
- LTV:CAC Ratio: A 3-year LTV would be ($18,000 ACV × 0.75 Gross Margin × 3 years) = $40,500. The LTV:CAC ratio is $40,500 ÷ $2,648 = 15.3:1. (This is exceptionally high, indicating a very efficient model).
- CAC Payback Period: Monthly revenue is $1,500. Gross-margin-adjusted monthly revenue is $1,500 × 0.75 = $1,125. Payback is $2,648 ÷ $1,125 = 2.35 months.
Where the Calculation Breaks: The Ramp Cost Blind Spot
Here is the most common way that calculation goes wrong. Imagine two of those SDRs started mid-quarter. They are drawing a salary, which is in the numerator, but they won't be producing qualified pipeline for another 60 days. Their future customers are not yet in the denominator.
This inflates your CAC in the current quarter and artificially deflates it in the next, creating a sawtooth pattern that makes quarter-over-quarter comparisons meaningless. According to the KeyBanc SaaS Survey, average ramp times for new AEs can be 4-6 months. Ignoring this lag creates a distorted view of your true GTM efficiency.
The fix is to either lag new-hire costs by their average ramp period or to track and report on "ramped rep CAC" separately from the all-in number. This provides a stable, long-term view of acquisition efficiency.
The CAC Denominator Problem: Why Most SaaS Companies Miscalculate
The CAC formula has two variables. Most teams obsess over the numerator (what to include in costs) while treating the denominator (what counts as a "customer") as obvious. It isn't.
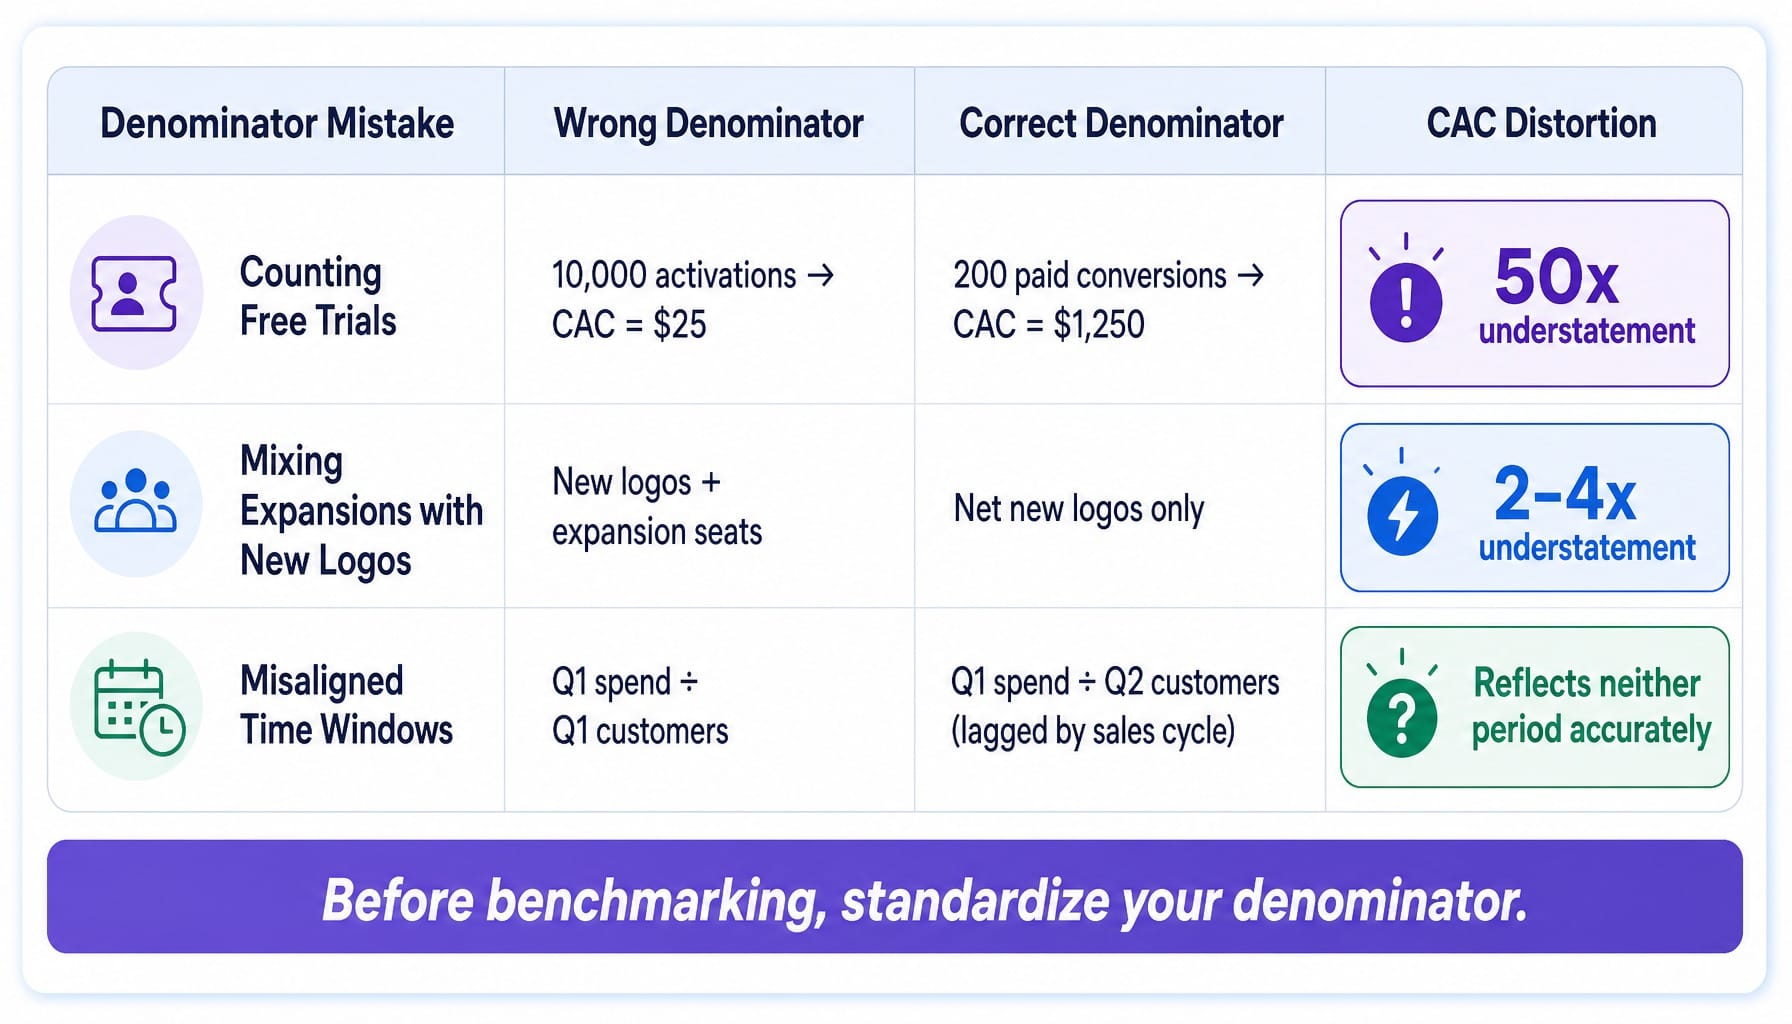
This is the CAC denominator problem: the definition of "customer" is a political choice that can distort your reported CAC by 2-4x. Here are three common ways it happens:
- Counting Free Trials as Customers. A product-led growth (PLG) company might have 10,000 free trial activations and 200 paid conversions from a $250,000 marketing spend. If the denominator is "activations," the CAC is a tidy $25. If the denominator is "paid customers," the CAC is $1,250. Same spend, same company, a 50x difference based on one definition.
- Mixing New Logos with Expansion Revenue. An existing customer adds 50 seats, generating $50,000 in new ARR. Is that a "new customer"? If you count it as such, your CAC looks artificially low because expansion revenue costs almost nothing to acquire. True CAC should only be measured against net new logos. Expansion efficiency should be measured separately as a function of your Customer Success and Account Management costs.
- Inconsistent Time-Window Alignment. Marketing spends $100k on a campaign in Q1. The leads generated from that spend have a 90-day sales cycle and don't start closing until late Q2. If you divide Q1 spend by Q1 customers, the resulting number reflects neither period's reality accurately.
This is why comparing your CAC to an industry benchmark is so dangerous. You have no idea what denominator that benchmark used. Your first step isn't optimizing spend; it's standardizing your denominator.
Blended CAC vs. Paid CAC vs. Organic CAC
Blended CAC averages all acquisition costs across all channels. Paid CAC isolates spend on paid channels (e.g., SEM, paid social, sponsorships) against customers directly attributable to those channels. Organic CAC captures the cost of non-paid efforts (content, SEO, community, brand) against customers who converted without a paid touchpoint.
This distinction is critical. Imagine a SaaS company with a healthy blended CAC of $800. After doing the channel-level analysis, they discover their paid CAC is actually $2,400, while their organic CAC is just $180.
The blended number was masking a massive inefficiency. Data from firms like FirstPageSage consistently shows that organic channels can produce a CAC that is 5-10x lower than paid channels for B2B SaaS. In this scenario, the company's paid channels are 13x more expensive. If the leadership team decides to scale spend based on the $800 blended number, they will be funding a GTM motion that is wildly unprofitable at the channel level.
This is why investors on your board increasingly want to see isolated channel CAC, not just the blended figure. Blended CAC obscures whether growth is efficient or simply being subsidized by a strong organic foundation.
Read more: Marketing Channel Prioritization for 2026: Where Your Budget Actually Compounds | Spike
What Is Fully Loaded CAC—and Why Investors Demand It
Fully loaded CAC (also called fully burdened CAC) includes every single cost that contributes to acquiring a customer. This goes beyond direct ad spend and sales commissions to include allocated overhead: RevOps and sales enablement headcount, CRM licenses, a portion of office rent for the sales team, management overhead, and even the recruiting costs for S&M hires.
Simple CAC, by contrast, typically only includes direct program spend and the salaries of frontline reps. The gap is significant. For a mid-market SaaS company, a simple CAC of $4,000 might translate to a fully loaded CAC of $6,500–$8,000—a 60–100% difference.
Why does this matter now? Because Series A+ investors, informed by data from KeyBanc and Bessemer, now require fully loaded CAC in board decks. Simple CAC flatters your unit economics and hides potential inefficiencies in your GTM cost structure.
A useful rule of thumb: if your fully loaded CAC is more than 1.8x your simple CAC, you may have a GTM cost structure problem, not just a marketing efficiency problem.
SaaS CAC Benchmarks That Actually Mean Something
Benchmark data is only useful if you know what denominator and cost definition the benchmark used. Most published SaaS CAC benchmarks are based on blended, simple CAC, which means they almost certainly understate the true, fully loaded acquisition cost.
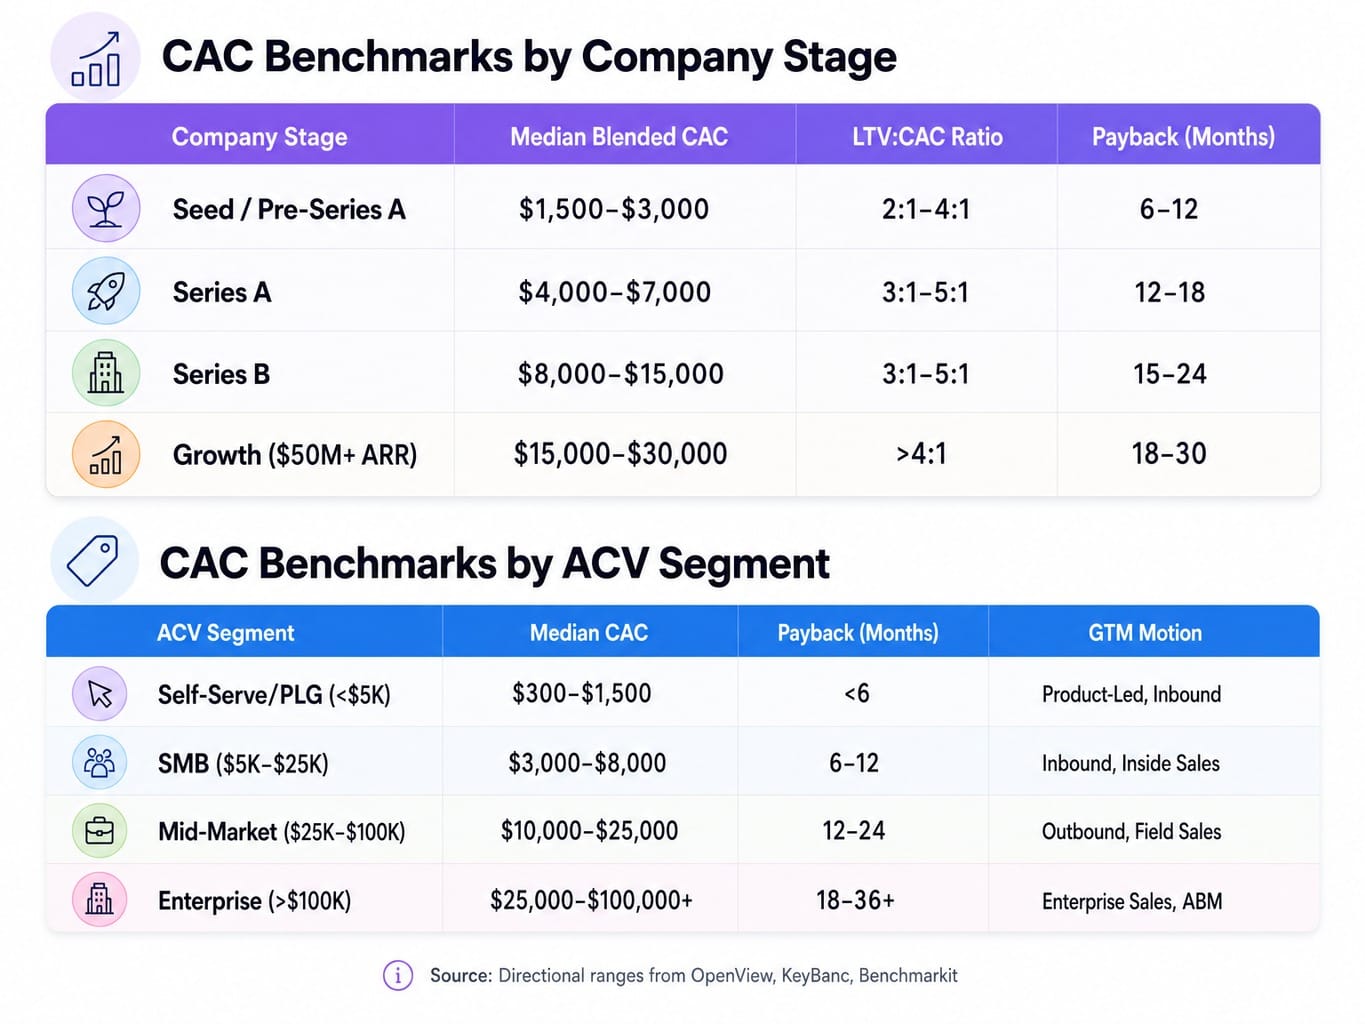
With that caveat, here are directional ranges sourced from industry reports by OpenView Partners, KeyBanc, and Benchmarkit. Use them to gauge your general position, not as absolute targets.
CAC Benchmarks by Company Stage
The jump in CAC at Series A often surprises founders. This "CAC wall" happens because founder-led sales (with zero allocated cost) are replaced by the company's first hired AEs. This rise is normal and expected, not a sign of a broken GTM motion.
CAC Benchmarks by ACV Segment
An enterprise CAC of $30,000 looks alarming in isolation. However, it's perfectly healthy when the ACV exceeds $100,000 and net revenue retention is above 120%. The metric that matters isn't CAC in isolation, but CAC relative to the gross-margin-adjusted lifetime value of that customer. This is where the payback period becomes the true north star.
CAC Payback Period: The Metric Investors Actually Care About
CAC Payback Period measures how many months it takes for a customer's gross profit to repay the cost of acquiring them. It is the ultimate measure of capital efficiency.
CAC Payback Period (in months) = CAC ÷ (Monthly ARPU × Gross Margin %)
The gross margin adjustment is non-negotiable. If your gross margin is 75%, it means only 75 cents of every dollar of new revenue is available to repay CAC; the rest covers your cost of goods sold (COGS), such as hosting, third-party data, and frontline customer support.
Using our previous example: a company with a $2,648 CAC and $1,500 in monthly ARPU at a 75% gross margin has a payback period of:
$2,648 ÷ ($1,500 × 0.75) = 2.35 months
For venture-backed SaaS, a payback period under 12 months is considered healthy. For enterprise-focused businesses with high net revenue retention, a payback under 18 months is often acceptable. Anything over 24 months signals a potential unit economics problem. High net revenue retention (NRR) can offset a longer payback period; if NRR is 130%, a customer that takes 18 months to pay back their CAC will still generate 5-7x their acquisition cost over their lifetime.
How to Reduce SaaS CAC Without Sacrificing Lead Quality
Most advice on reducing CAC starts with "spend less on paid ads" or "invest more in content." This misses the point. The highest-leverage CAC reduction strategy is to fix your measurement first. If your denominator is wrong, you are optimizing against a phantom number.
Once your measurement is clean, focus on three moves:
- Reallocate Budget to Proven Channels. After tracking isolated channel CAC for at least two quarters, shift budget aggressively toward the channels with proven lower CAC—typically organic search, community, and partnerships. Don't guess; use your own data.
- Improve Bottom-of-Funnel Conversion. A 20% improvement in your trial-to-paid or demo-to-close conversion rate reduces your CAC by 20% without touching a dollar of ad spend. This is the most underleveraged area for most SaaS teams because it requires a consistent rhythm of experimentation and implementation.
- Shorten the Sales Cycle. Every week you can shave off your average sales cycle reduces the S&M cost allocated to each deal. This is achieved through better lead qualification, clearer onboarding, and removing friction from the evaluation process.
A final warning: reducing CAC without tracking lead quality is dangerous. You can easily halve your CAC by targeting cheaper, lower-intent segments that churn in three months. This destroys your LTV:CAC ratio and is a surefire way to burn capital.
Read more: Pipeline Marketing in 2026: Strategy, Metrics, and Why Most Teams Regress to Lead Gen | Spike
What Happens When Conversion Optimization Runs Continuously
The highest-leverage move to reduce CAC is improving bottom-of-funnel conversion rates. Yet most lean teams underinvest here because true conversion optimization isn't a one-off project; it requires a continuous loop of identifying issues, shipping fixes, measuring results, and re-prioritizing. That's an execution cadence most teams don't have the bandwidth for.
Spike AI is the system that runs this loop for you. It continuously identifies the highest-impact changes across your website and landing pages, then executes them in weekly releases. Instead of quarterly CRO sprints that lose momentum, Spike AI compounds small weekly conversion gains that directly and sustainably reduce your CAC. If weekly improvements compound to a 15% lift over a quarter, that's a 15% CAC reduction with zero additional ad spend.
See how Spike AI reduces your CAC through continuous conversion optimization
Your CAC Is a Verdict on Your Definitions
SaaS CAC is not a formula problem—it's a problem of definition and discipline. Before you benchmark, optimize, or panic about your number, your job is to ensure it's telling the truth.
Standardize your denominator. Separate blended CAC from isolated channel CAC. Calculate your payback period on a gross-margin basis. Only then will you have a number that means something you can act on.
The companies that win on CAC efficiency in 2026 won't be the ones that simply spend less. They will be the ones that measure more honestly and convert more of what they already have, faster and more consistently than their competition.
Frequently Asked Questions
Should founder-led sales be included in SaaS CAC calculations?
Yes, though most early-stage companies don't. You should allocate a percentage of the founder's compensation proportional to the time they spend on sales activities. Excluding it makes pre-Series A CAC look artificially low and creates a misleading baseline that breaks the moment you hire your first AE.
Should customer success costs be included in CAC or counted as retention cost?
Customer success is a retention cost, not an acquisition cost—unless CS staff actively participate in the pre-sale process (e.g., technical demos that influence the purchase). If CS only handles post-sale onboarding and support, their cost should be measured against net revenue retention, not CAC.
How does net revenue retention offset a high CAC?
High NRR (above 120%) means existing customers expand their spending faster than other customers churn, increasing LTV without additional acquisition spend. A company with a $15,000 CAC and 130% NRR can be far more profitable than one with a $5,000 CAC and 90% NRR. Evaluate CAC and NRR together.
Why is my CAC increasing even though the pipeline is growing?
This usually has three causes. First, you've hired new sales reps who are still ramping; their cost is in the numerator but their closed deals aren't in the denominator yet. Second, you're moving upmarket into longer, higher-touch sales cycles. Third, you've saturated low-cost organic channels and are scaling paid acquisition, which has a structurally higher CAC.
How does product-led growth affect SaaS CAC measurement?
PLG compresses CAC by replacing sales-assisted conversion with a self-serve motion, but it doesn't eliminate it. You must still account for the product, engineering, and growth team costs that drive the PLG engine. The denominator problem also intensifies: do you count free users, activated users, or only paid conversions? Most PLG companies report misleadingly low CAC by using the broadest possible denominator.