The True Cost of Marketing Tools: Why Your Stack Costs 8–18× Its Listed Price
TL;DR
- The subscription fee for a marketing tool is only 6–12% of its true cost of ownership (TCO) for a lean B2B team.
- We calculated the TCO for 7 popular tools (Ahrefs, HubSpot, SEMrush, etc.) and found the true cost is 8 to 18 times the listed price.
- The largest hidden cost isn't implementation or training; it's the "action gap"—the revenue value of tool-generated insights that your team lacks the bandwidth to ship.
- Hidden costs include labor for implementation, training, monthly maintenance, integration upkeep, and the opportunity cost of tool recommendations that end up in a backlog.
- Use our six-layer framework and downloadable spreadsheet to calculate your own stack's TCO and change how you approach every renewal conversation.
A three-person B2B SaaS marketing team runs their annual tool audit. They tally up the software subscriptions: Ahrefs, HubSpot, Hotjar, SEMrush, Mailchimp, and Optimizely, plus Google Ads management. The total comes to $38,000. When the CFO asks if the spend is justified, the marketing lead points to the figure, confident in the value delivered for the price.
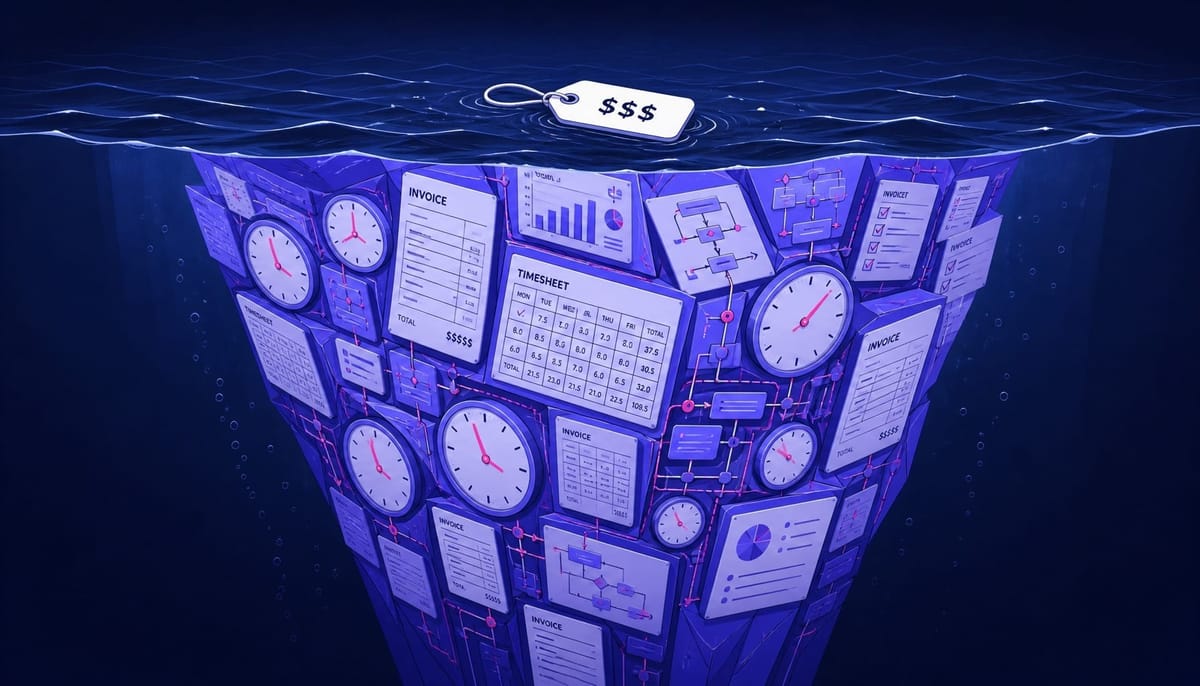
But that $38,000 isn't the price. It's the down payment.
When you add the internal hours for implementation, the learning curve to reach proficiency, the monthly maintenance burden, the integration overhead via Zapier, and—most critically—the value of tool-generated recommendations that never get shipped, the real number lands somewhere between $300,000 and $680,000.
That's not a rounding error. It's an 8–18× multiplier on the sticker price, and it represents the true cost of marketing tools.
This article presents the full methodology behind that multiplier. We calculate the total cost of ownership (TCO) for seven tools your B2B team actually uses, include a sensitivity analysis for different hourly rates and team sizes, and provide a downloadable spreadsheet so you can finally run the numbers on your own stack.
The TCO Methodology: Six Cost Layers Most Teams Never Calculate
The core problem is simple: most marketing teams evaluate tools by subscription price alone because the other costs are distributed across calendars, salaries, and opportunity costs. They never appear on a single line item, so they never get counted. Finance teams approving these purchases based on sticker price are systematically underestimating the real resource draw, which means every headcount conversation and vendor renewal is built on flawed inputs.
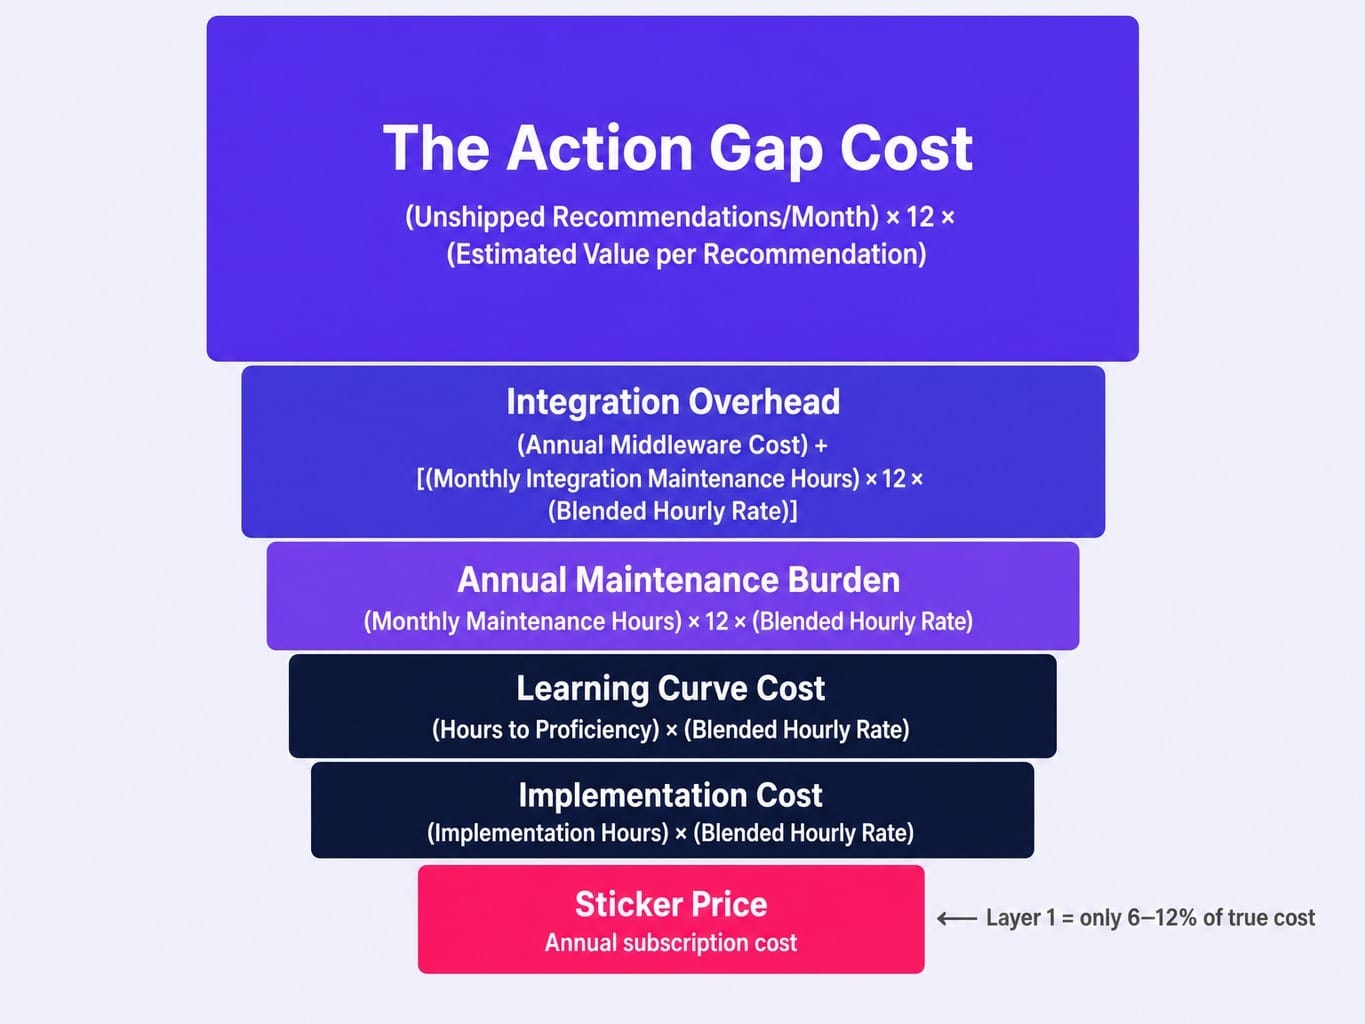
To find the real number, we use a six-layer TCO framework.
Layer 1: Sticker Price
This is the annual subscription cost for the plan tier a lean B2B team (3–5 people) actually needs, not the cheapest entry-level plan or the sprawling enterprise tier.
Layer 2: Implementation Cost
This is the one-time labor cost to get the tool running. It includes initial setup, connecting data sources, configuring settings, and integrating it into primary workflows.
Formula: (Implementation Hours) × (Blended Hourly Rate)
Layer 3: Learning Curve Cost
This is the cost of training the team to a state of working proficiency—the point where they can use the tool for routine tasks without consulting documentation. It's not about mastery; it's about basic operational competence.
Formula: (Hours to Proficiency) × (Blended Hourly Rate)
Layer 4: Annual Maintenance Burden
This is the recurring labor cost required to keep the tool functional and useful. It includes pulling reports, building dashboards, troubleshooting issues, and managing settings. Consider the marketing manager who spends four hours every Monday pulling data from three different dashboards for a weekly standup—that's a maintenance cost that never appears on an invoice.
Formula: (Monthly Maintenance Hours) × 12 × (Blended Hourly Rate)
Layer 5: Integration Overhead
This is the cost to make your tools talk to each other. It includes the subscription for middleware like Zapier or Make, plus the hours spent building, maintaining, and debugging the connections that break when one tool updates its API.
Formula: (Annual Middleware Cost) + [(Monthly Integration Maintenance Hours) × 12 × (Blended Hourly Rate)]
Layer 6: The Action Gap Cost
This is the largest and most overlooked cost: the opportunity cost of tool-generated insights that are never acted upon. If a tool surfaces 10 valuable recommendations a month and your lean team only has the bandwidth to ship three, the 70% action gap represents unrealized revenue. This isn't a hypothetical; marketing teams use only 33% of their martech stack's capabilities.
Formula: (Unshipped Recommendations/Month) × 12 × (Estimated Value per Recommendation)
Our baseline assumption for the blended hourly rate is $75. This is derived from typical mid-level B2B SaaS marketer salaries, which range from $65,000 to $95,000 annually, plus benefits and overhead. All assumptions are documented, and the downloadable spreadsheet lets you plug in your own numbers.
Read more: SaaS Marketing Tools in 2026: How to Build a Stack That Ships, Not Just Reports
Tool-by-Tool TCO Analysis: 7 Tools Your Team Actually Uses
We selected seven tools that appear most frequently in the stacks of B2B SaaS teams with 1–5 marketers, based on industry surveys and practitioner communities: Ahrefs, HubSpot Marketing Hub, SEMrush, Hotjar, Mailchimp, Google Ads, and Optimizely.
Each analysis follows the same six-layer framework. A summary comparison table appears at the end of this section. The downloadable spreadsheet includes all seven tools pre-populated with these baseline assumptions, plus blank rows for you to add your own.
Ahrefs: $2,388/Year Sticker Price → $19K–$38K True Cost
- Sticker Price: $2,388/year for the Standard plan ($199/month), the minimum viable tier for a team needing Site Audit, Rank Tracker, and Content Explorer.
- Implementation Cost: Relatively low. ~8 hours to connect a site, set up projects, and configure alerts. Cost: $600.
- Learning Curve Cost: Ahrefs has a notoriously steep learning curve, especially for Site Explorer and its filtering logic. We estimate 25 hours to reach working proficiency for a new user. Cost: $1,875.
- Annual Maintenance Burden: ~4 hours/month pulling rank reports, running ad-hoc audits, and exporting data for team review. Cost: $3,600.
- Integration Overhead: Basic Zapier connection to Slack or Google Sheets for automated alerts, plus ~1 hour/month maintaining it. Cost: $1,200.
- Action Gap Cost: Ahrefs surfaces dozens of technical SEO issues, keyword gaps, and backlink opportunities monthly. A lean team realistically acts on 20–30% of them. At a conservative $500 estimated value per shipped item (based on incremental organic traffic value), a 70% action gap across 10 core recommendations per month creates a massive deficit. Cost: $42,000.
Total True Cost: $7,263 (without action gap) to $49,263 (with action gap).
Multiplier: 3× to 20×. The sheer volume of insights creates a backlog that costs more than the tool itself.
For a deeper look at what you're actually paying for the Standard plan and its per-deliverable math, see our breakdown of Ahrefs pricing.
HubSpot Marketing Hub: $9,600/Year Sticker Price → $48K–$95K True Cost
- Sticker Price: $9,600/year for the Professional plan ($800/month), where B2B teams get workflows and A/B testing. This ignores the common "SSO tax" and per-seat add-ons that inflate the base price.
- Implementation Cost: HubSpot is complex to set up properly. Lifecycle stages, lead scoring, workflow automation, and CRM data mapping require significant planning. We estimate 60-80 hours for a lean team doing it themselves. Cost: $4,500–$6,000.
- Learning Curve Cost: Reaching working proficiency across the marketing hub, CRM, and reporting dashboards takes time. We estimate ~40 hours, including time spent on HubSpot Academy. Cost: $3,000.
- Annual Maintenance Burden: HubSpot requires constant gardening: workflow debugging, list hygiene, report building, and portal cleanup. This isn't optional; it's the cost of data integrity. Estimate 8 hours/month. Cost: $7,200.
- Integration Overhead: This is a major cost center. Connecting HubSpot to Salesforce, ad platforms, and enrichment tools involves native integrations and middleware. ~3 hours/month troubleshooting sync errors and field mapping drift. Cost: $3,600.
- Action Gap Cost: I once audited a HubSpot instance where the team paid for the Professional tier but used fewer than 20% of the available workflow automations because no one had the bandwidth to design and maintain them. The gap between purchased capability and deployed capability is enormous. At a conservative $750/recommendation value (insights are closer to revenue), a 75% action gap on 8 recommendations/month is a huge liability. Cost: $54,000.
Total True Cost: $29,400 (without action gap) to $83,400 (with action gap).
Multiplier: 3× to 8.7×. The multiplier is lower because the sticker price is so high, but the absolute dollar waste is the largest in the stack.
SEMrush: $1,668/Year Sticker Price → $16K–$30K True Cost
- Sticker Price: $1,668/year for the Pro plan ($139.95/month).
- Implementation Cost: ~10 hours to configure projects, set up position tracking, and connect Google Search Console and Analytics. Cost: $750.
- Learning Curve Cost: SEMrush suffers from significant feature sprawl. Reaching proficiency on just the core SEO and content toolkits takes ~20 hours. Cost: $1,500.
- Annual Maintenance Burden: ~3 hours/month on keyword tracking reviews, site audit monitoring, and competitive analysis pulls. Cost: $2,700.
- Integration Overhead: Basic Zapier connections plus ~1 hour/month of upkeep. Cost: $1,100.
- Action Gap Cost: The pattern is identical to Ahrefs. SEMrush surfaces technical issues and content opportunities that pile up in a backlog. We estimate a 65% action gap at a $450/recommendation value. Cost: $21,060.
Total True Cost: $6,050 (without action gap) to $27,110 (with action gap).
Multiplier: 3.6× to 16×. Many teams run both SEMrush and Ahrefs, creating significant tool overlap. This means they are paying the hidden maintenance and integration costs twice for largely redundant capabilities. This is the "stack bloat" tax.
If you're weighing whether you need both tools, our Ahrefs vs Semrush comparison covers the workflow differences that actually matter.
Hotjar: $780/Year Sticker Price → $9K–$18K True Cost
- Sticker Price: $780/year for the Business plan ($65/month).
- Implementation Cost: Quick. Installing the script and setting up initial recordings and heatmaps takes ~5 hours. Cost: $375.
- Learning Curve Cost: The interface is intuitive, but learning to interpret heatmaps and session recordings for meaningful patterns (not just watching random sessions) takes ~12 hours. Cost: $900.
- Annual Maintenance Burden: ~3 hours/month reviewing new recordings, analyzing heatmaps, and managing feedback widgets. Cost: $2,700.
- Integration Overhead: Minimal. Zapier for survey responses to Slack or a CRM, with ~0.5 hours/month of maintenance. Cost: $650.
- Action Gap Cost: This is where Hotjar's TCO explodes. The tool is brilliant at diagnosis but completely absent from treatment. It shows you exactly where users rage-click, but it ships zero fixes. Every insight requires a designer, developer, or marketer to implement a change. We estimate 80% of Hotjar insights go unshipped. At a low $400/recommendation value, this is a massive hidden cost. Cost: $38,400.
Total True Cost: $4,625 (without action gap) to $43,025 (with action gap).
Multiplier: 6× to 55×. Hotjar is the purest example of the insight-to-action gap. It's a tool that creates homework, and the cost of that unshipped homework dwarfs the subscription fee.
Mailchimp: $1,560/Year Sticker Price → $12K–$22K True Cost
- Sticker Price: $1,560/year for the Standard plan ($130/month) with ~10,000 contacts. Note that this price scales aggressively with list size.
- Implementation Cost: ~12 hours for template setup, list migration, audience segmentation, and initial automation workflows. Cost: $900.
- Learning Curve Cost: ~15 hours to understand segmentation, the automation builder, A/B testing, and deliverability management. Cost: $1,125.
- Annual Maintenance Burden: ~5 hours/month on list hygiene, template updates, campaign reporting, and deliverability monitoring. Cost: $4,500.
- Integration Overhead: Connecting to a CRM, e-commerce platform, or landing page tools. Zapier plus ~2 hours/month of maintenance. Cost: $2,400.
- Action Gap Cost: Mailchimp's reports surface open rate trends and click patterns, but optimizing sequences and rewriting underperforming subject lines requires dedicated time. We estimate a 55% action gap at a $300/recommendation value. Cost: $11,880.
Total True Cost: $8,925 (without action gap) to $20,805 (with action gap).
Multiplier: 5.7× to 13×. The per-contact pricing model means the sticker price is a moving target, causing the multiplier to compound as your list grows.
Google Ads: $0 Platform Fee → $15K–$35K True Management Cost
- Sticker Price: $0. This is the most counterintuitive entry, as the platform itself is free (ad spend is a separate budget item).
- Implementation Cost: ~20 hours for proper account structure, conversion tracking setup, audience configuration, and initial campaign builds. Cost: $1,500.
- Learning Curve Cost: Google Ads is one of the most complex marketing tools. Reaching proficiency in Search, Display, and Performance Max takes at least ~40 hours. Cost: $3,000.
- Annual Maintenance Burden: ~8 hours/month on bid management, search term reviews, negative keyword updates, and quality score optimization. Cost: $7,200.
- Integration Overhead: Connecting to a CRM for offline conversion tracking, analytics platforms, and call tracking tools requires ~3 hours/month of upkeep. Cost: $2,700.
- Action Gap Cost: The "Recommendations" tab surfaces ideas constantly, but many are self-serving for Google. A skilled marketer must evaluate each one. We estimate 60% of genuinely useful optimizations go unshipped due to bandwidth. At a $600/recommendation value, this is a significant loss. Cost: $25,920.
Total True Cost: $14,400 (without action gap) to $40,320 (with action gap).
Multiplier: Infinite. The point is more important than the math: "free" tools are never free. Their true cost is 100% labor and expertise.
Optimizely: $36,000/Year Sticker Price → $72K–$140K True Cost
- Sticker Price: Starts around $36,000/year for the Web Experimentation platform for most B2B teams. Pricing is opaque and negotiated.
- Implementation Cost: Requires significant technical setup: snippet installation, event tracking, and QA processes. We estimate 40–60 hours involving both marketing and engineering. Cost: $3,000–$4,500.
- Learning Curve Cost: The platform is powerful but complex. Interpreting the Stats Engine and designing valid experiments takes ~30 hours to learn properly. Cost: $2,250.
- Annual Maintenance Burden: ~6 hours/month monitoring experiments, reviewing results, and reporting to stakeholders. Cost: $5,400.
- Integration Overhead: Connecting to analytics, a CDP, or a CRM for audience syncing. ~2 hours/month plus potential middleware costs. Cost: $2,400.
- Action Gap Cost: This is the cruelest irony. Optimizely exists to test changes, but the bottleneck for most teams is the bandwidth to design, build, and QA the test variants. Most teams run 1-2 tests per month when they should be running 8-10. We estimate 75% of potential tests never launch. At a $1,200/test value (based on average conversion lift), this is a staggering loss. Cost: $86,400.
Total True Cost: $49,050 (without action gap) to $135,450 (with action gap).
Multiplier: 1.4× to 3.8×. Like HubSpot, the multiplier is lower because the sticker price is so high, but the absolute waste is immense. Enterprise tools don't solve the action gap; they just make it more expensive.
The Multiplier Range: Why Your Stack Costs 8–18× Its Listed Price
When synthesized, the analysis of these seven tools reveals a clear and uncomfortable pattern for lean B2B SaaS marketing teams.
Summary TCO Analysis
Across this common stack, the true cost of ownership ranges from 8× to 18× the listed subscription price. This isn't an outlier; it's the norm for lean teams where human bandwidth is the primary constraint.
This range holds even when we adjust our assumptions.
Sensitivity Analysis: TCO Multiplier
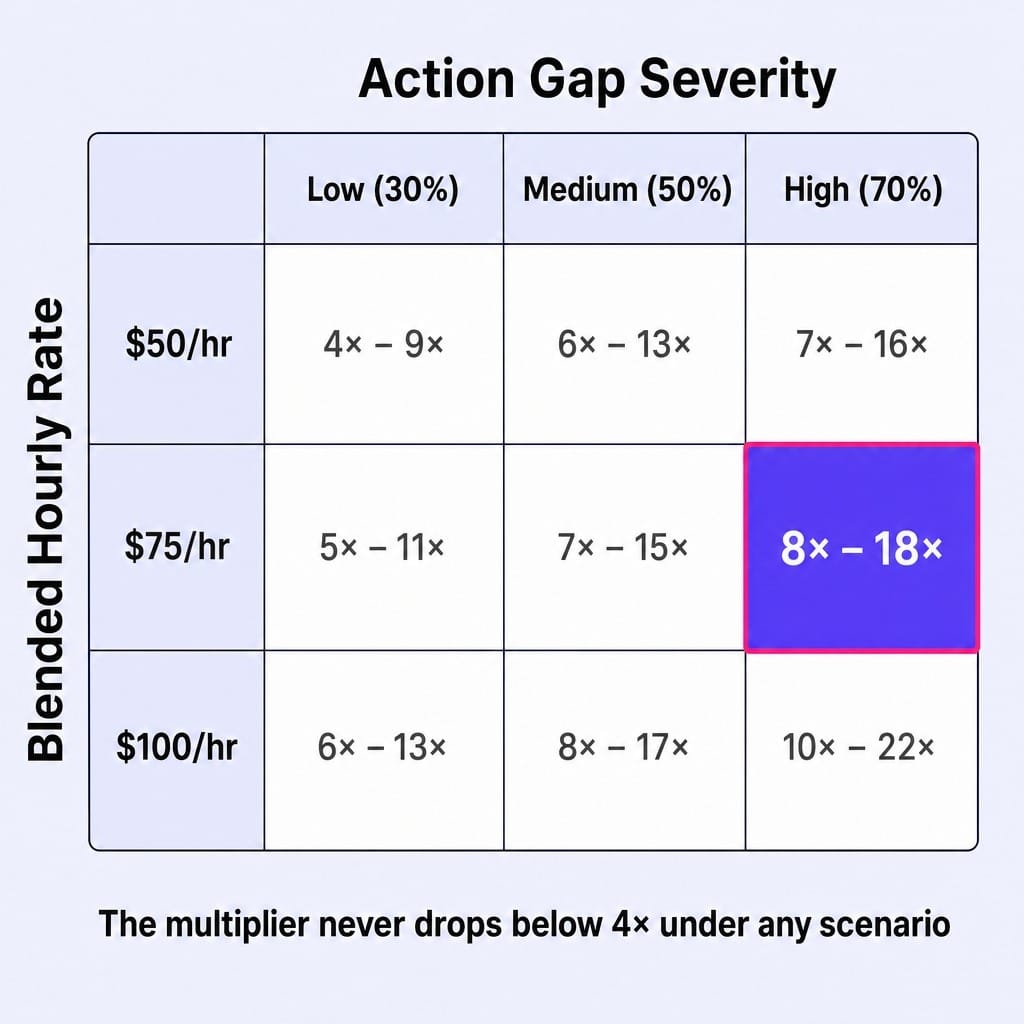
Even at the most generous assumptions—a lower hourly rate and a smaller action gap—the multiplier never drops below 4×. For most lean teams, 8–18× is the reality. This is the invoice your CFO never sees. And this range is conservative; it excludes switching costs, contract auto-renewal traps, and the compounding cost of bad data flowing between poorly integrated tools.
The Action Gap: The Largest Cost That Appears on No Invoice
Across all seven tools, a clear pattern emerged: the action gap—the value of tool-generated insights that are never implemented—accounts for 40–70% of the true cost of ownership.
This is not a tool problem. It is a throughput problem.
The tools are doing their job. They surface what needs to change. The breakdown happens between the insight and the implementation. For lean teams, this gap is structural. Every recommendation competes for the same finite hours. There is no reliable system to determine which recommendation will move revenue most. And shipping even a small change requires coordination across content, design, and analytics.
Consider the classic Hotjar scenario. A session recording reveals that 40% of visitors abandon a pricing page at the feature comparison table. The fix is clear: simplify the table, add a CTA above the fold. But the marketer needs a designer to mock it up, a developer to deploy it, and a stakeholder to approve it. Three weeks pass. The recording is forgotten. The page still leaks conversions.
This is the action gap in practice. It isn't laziness; it is the structural constraint of lean teams operating a complex martech stack with too few hands. This is the execution gap most teams never close.
What If the Largest Cost in Your Stack Simply Disappeared?
The analysis leads to a stark conclusion: lean marketing teams pay 8–18× the sticker price for their tools, and the dominant cost is the gap between what tools recommend and what actually gets shipped.
The resolution, then, is not another tool that surfaces more insights. It's a system that closes the gap between insight and implementation.
This is where Spike AI re-frames the problem. It is an execution engine designed to eliminate the action gap. Every week, Spike AI's marketing AGI identifies the single highest-impact move across your website, SEO, and ads—then ships it. It doesn't just add to your backlog; it clears it.
This doesn't mean replacing your entire stack. It means making your existing stack's insights finally reach production. Take the Hotjar example: Spike AI would identify that pricing page drop-off, prioritize it against every other opportunity, and deploy the fix without requiring a designer, a developer, or a three-week approval cycle.
The math is straightforward. If the action gap costs your team $150,000 a year in unrealized value, and a system can close that gap for a fraction of the cost, the ROI is self-evident. You stay in control. Spike AI handles the shipping.
See how Spike AI closes the action gap across your entire marketing stack.
Conclusion
The price on the invoice is the smallest component of what your marketing tools actually cost. The largest cost—the gap between insight and implementation—is the one most teams have never quantified.
We calculated the TCO across seven common tools using a transparent methodology and found that lean B2B teams pay 8 to 18 times the listed price. Our sensitivity analysis confirms this range holds across all reasonable assumptions for a resource-constrained team.
The next time your team evaluates adding a tool to the stack, run it through this six-layer framework before signing the contract. And for the tools already in your stack, download the spreadsheet and calculate your own multiplier. The number will change how you think about every renewal conversation, every headcount request, and the very structure of your marketing execution system.
Frequently Asked Questions
How do per-seat pricing models inflate marketing tool costs over time?
Per-seat pricing creates a compounding problem. As a team grows, the sticker price increases linearly, but the hidden costs—training, maintenance, and integration management for each new user—increase faster. Each new seat requires onboarding, workflow adjustments, and permission management, adding to the maintenance burden. This "seat tax" often comes with a "feature tax," where tools like HubSpot gate critical automation features behind higher tiers, forcing you to upgrade for the whole team just to access one capability.
Is it cheaper to consolidate into an all-in-one platform or use best-of-breed tools?
It depends on which cost layer dominates your stack. All-in-one platforms like HubSpot can reduce integration overhead, but they often have steeper learning curves and create significant vendor lock-in, or "migration debt." Best-of-breed stacks offer deeper functionality but multiply every hidden cost layer, especially the integration tax and the risk of tool overlap. For most lean teams, a TCO analysis reveals that the integration and maintenance burden of a "Frankenstack" of best-of-breed tools often exceeds the capability compromises of a consolidated platform.
What percentage of marketing tools go unused after purchase?
Gartner reports that marketing teams utilize only 33% of their martech stack's capabilities. It's more precise to think in terms of a "capability utilization rate" rather than pure shelfware. A tool may be used daily, but if you're only using 20-40% of the features you pay for, the remaining 60-80% are a form of zombie subscription. This is especially true for platforms where the most valuable automation and orchestration features are the hardest to implement and thus the first to be ignored by a bandwidth-constrained team.
How does vendor lock-in increase the long-term cost of marketing software?
Vendor lock-in creates "migration debt"—the accumulated cost of switching away from a tool grows the longer you use it. Historical data, workflow dependencies, team muscle memory, and complex integrations all become switching costs. For deeply embedded systems like Salesforce or HubSpot, the labor cost to migrate can run from $20,000 to $80,000. This means the true cost of a tool includes not just what you pay to use it, but what you would have to pay to leave it. That cost grows every quarter.
How should I build a business case for cutting underperforming marketing tools?
Use the six-layer TCO framework from this article to calculate the tool's true cost, then compare it to its measurable contribution to pipeline or revenue. The strongest business cases quantify the "reverse TCO"—what you save by removing the tool, including recovered labor hours, eliminated integration overhead, and reduced context-switching. If a tool's primary value is producing reports that no one acts on, its action gap cost alone often justifies removal.
How do AI-native marketing tools change the cost equation compared to traditional martech?
AI-native platforms collapse multiple cost layers. They can reduce implementation time through self-configuration, compress the learning curve with natural language interfaces, and lower the maintenance burden via automated monitoring. Most critically, they shrink the action gap by moving from insight to implementation without requiring human coordination across multiple departments. The cost equation shifts from "license + labor to operate" to "license + oversight to approve." For lean teams, this can reduce the TCO multiplier from the 8–18× range to a more manageable 2–4×.