
Marketing Tool Debt: The Four Types Draining Your Team (and How to Diagnose Them)

TL;DR
- Marketing tool debt is the operational cost of tools that create work instead of eliminating it, manifesting as integration, learning, data, and workflow debt.
- Integration debt is the fragility of connector chains (like Zapier workflows) that become "untouchable" black boxes when the original builder leaves.
- Learning debt is the gap between a tool's capabilities and your team's actual usage, meaning you pay full price for a fraction of the value (i.e., "shelfware").
- Data debt is the cost of siloed analytics across tools that never agree on the same numbers, forcing hours of manual reconciliation before any strategic discussion.
- Tool debt compounds because each new tool multiplies complexity, and one-time cleanup projects fail without changing the underlying procurement culture that created the debt.
It's Monday morning. Someone asks why last week's campaign numbers in HubSpot don't match the numbers in GA4, which don't match the numbers in the board deck. Three people spend 90 minutes reconciling dashboards before anyone can discuss what to do next. Meanwhile, the Zapier workflow that pushes form submissions to Slack has been broken since Thursday, and nobody noticed because the person who built it left six months ago.
This isn't a strategy problem. It's not a budget problem. This is marketing tool debt. And like technical debt in software engineering, it compounds silently until it brings your team to a halt.
When every new campaign requires a project manager to coordinate handoffs between five tools before a single visitor sees a variation, experimentation velocity drops to a pace where quarterly learning cycles replace weekly ones. This is the execution gap created by tool debt. The debt isn't just a line item on an invoice; it's the operational drag that slows your entire marketing function.
It manifests in four specific, diagnosable types: integration debt, learning debt, data debt, and workflow debt. Most teams are carrying all four simultaneously without ever naming them. It's time to change that.
What Marketing Tool Debt Is (and Why the Technical Debt Analogy Is Precise, Not Metaphorical)
Marketing tool debt is the accumulated operational cost of every tool in your stack that creates work instead of eliminating it. The parallel to technical debt is not a loose metaphor; it's a structural analog. In software, technical debt accrues when engineers ship code quickly and defer the cleanup. In marketing, tool debt accrues when teams add point solutions to solve immediate problems without accounting for the long-term costs those tools introduce.
The martech landscape now includes over 14,000 tools, and the surface area for debt accumulation has never been larger. This isn't just about having too many tools. It's about the hidden operational costs that grow between them.
Tool debt has an interest rate. Every month you carry it, the cost increases, not because the subscription price goes up, but because the manual workarounds, knowledge gaps, and data inconsistencies compound. It's the reason marketers report using only 33% of their martech stack's full capabilities. The other 67% isn't just waste; it's a source of accumulating debt.
Integration Debt: The Zapier Chains Nobody Wants to Touch
Your team has a 7-step Zapier workflow. It pushes form submissions from your landing page to HubSpot, triggers a Slack notification, adds a row to a Google Sheet for the SDR team, and fires a webhook to your enrichment tool. It was built eighteen months ago by someone who has since left. It works, mostly. Occasionally a submission disappears. Nobody knows which step fails, and nobody wants to touch it because changing one filter might break three other steps.
This is integration debt: the accumulated fragility of connector chains, webhook sequences, and API bridges holding your stack together.
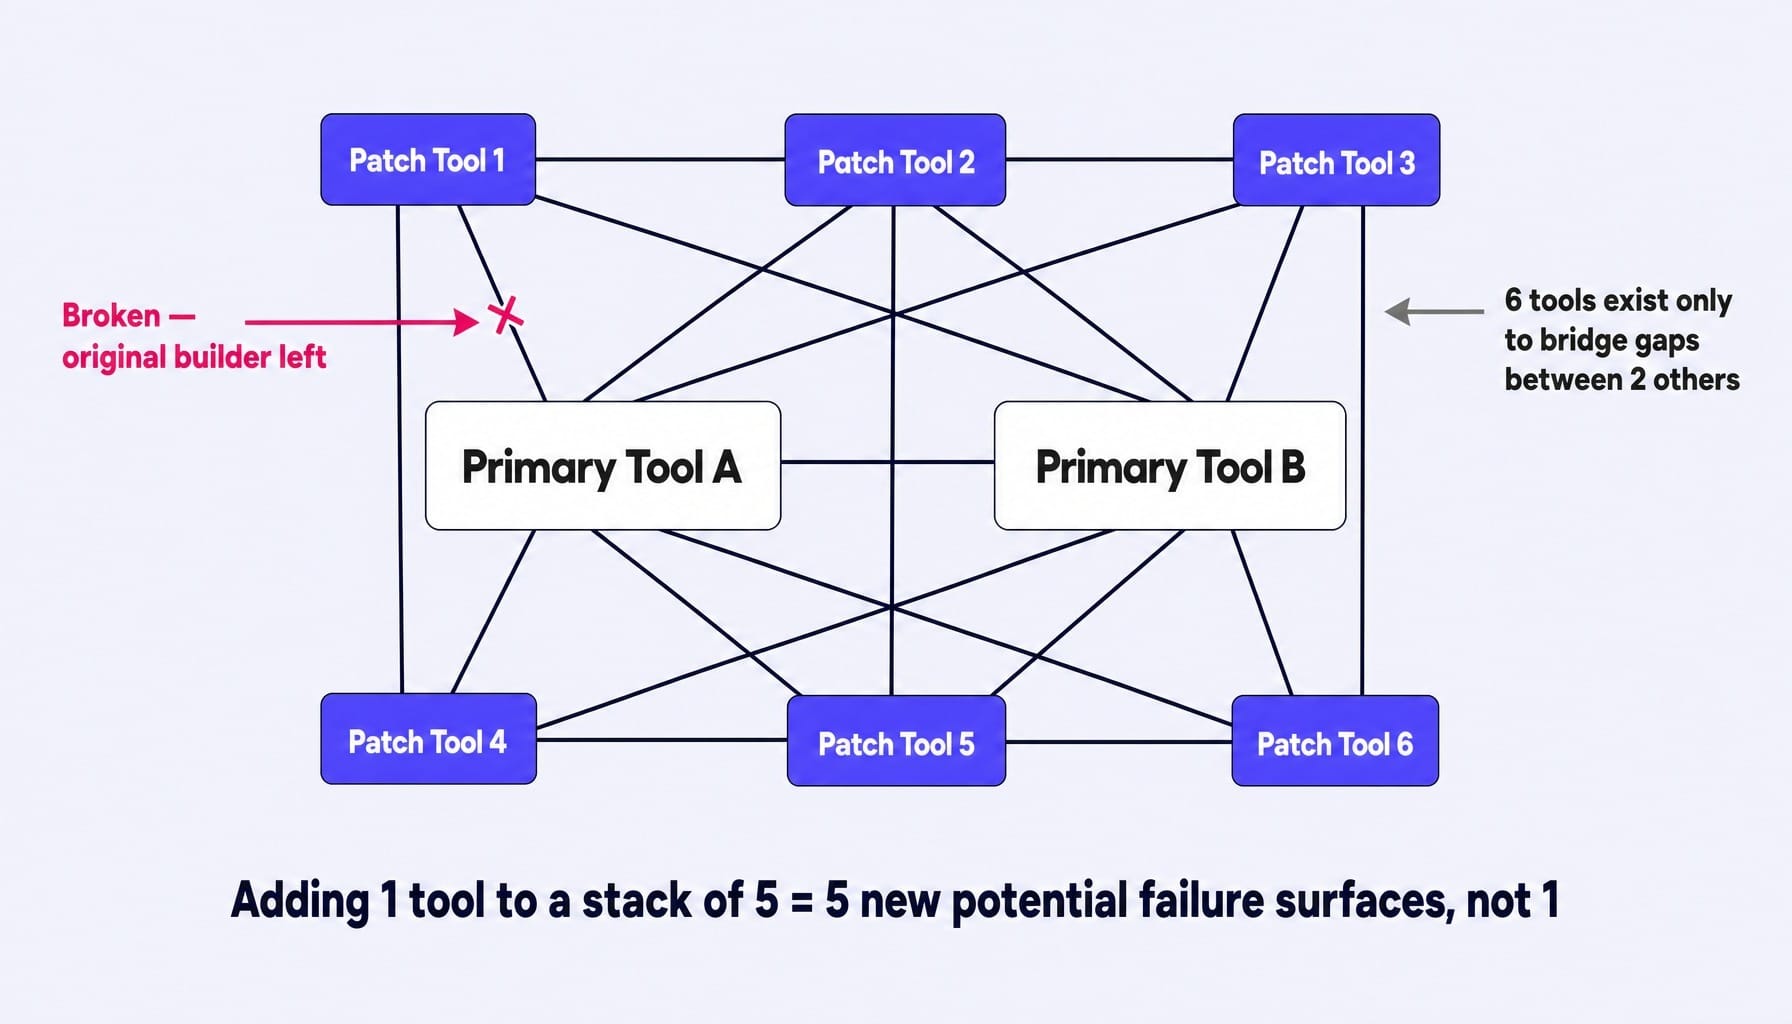
This debt isn't about the tools themselves; it's about the brittle connective tissue between them. I once audited a 14-tool marketing stack for a Series B company and discovered six of those tools existed solely to patch gaps created by two others. The patch tools had a lower subscription cost, but their maintenance—fixing broken Zaps, managing API keys—consumed triple the hours. This is the hidden cost of a Frankenstack.
Every point-to-point connection is a liability requiring maintenance, monitoring, and institutional knowledge. When the person who built the integration spaghetti leaves, the connection becomes an untouchable black box. This is where debt compounds. Each new tool added to the stack doesn't just add one integration; it adds N integrations, where N is every other tool it needs to talk to.
Read more: Stop Syncing Strategy and Execution: Platforms That Unify Marketing Goals With Task Management
Learning Debt: Paying Monthly for Features You Have Never Configured
Your team pays $800/month for a marketing automation platform. You use it to send emails and host landing pages. It also has lead scoring, behavioral triggers, multi-touch attribution, and A/B testing with statistical significance calculations. You have never configured any of them. The onboarding webinar was two hours long, your team watched 40 minutes, and the remaining features have sat untouched for fourteen months.
This is learning debt: the gap between what a tool can do and what your team actually uses. It's the most expensive form of marketing tool debt because you are paying full price for a fraction of the value. These unused capabilities become shelfware—features that sit on the shelf, gathering dust while costing you money.
Learning debt compounds in a specific, insidious way. The longer a feature goes unconfigured, the more your team builds manual workarounds that make the feature harder to adopt later. If you never set up your platform's native lead scoring, your SDRs will build their own qualification process in a spreadsheet. Now, adopting the platform's feature means not just learning how it works but also dismantling a manual process that, in their eyes, "just works." The switching cost feels too high, so the learning debt remains.
Tools that audit license utilization rates, like Zylo or Productiv, can quantify this gap. But an audit alone doesn't pay down the debt; it just puts a number on it.
Data Debt: Five Dashboards That Never Agree on the Same Number
It's the first Monday of the month. You pull numbers for the board deck. GA4 says the website had 12,400 sessions. HubSpot says 11,200 contacts visited. The paid media dashboard reports 3,100 clicks drove 890 conversions. The CRM shows 47 MQLs. None of these numbers are wrong. None of them agree. Your team spends three hours building a reconciliation spreadsheet before anyone can discuss what happened—let alone what to do next.
This is data debt: the accumulated cost of analytics siloed across tools that define metrics differently, track users differently, and attribute outcomes differently.
This isn't just a data quality problem; it's a data governance crisis disguised as a tooling problem. Each tool has its own tracking pixel, its own attribution model, its own definition of a "conversion." When you add a new tool, you don't just add a data source; you add a new version of the truth that must be manually reconciled with every other version.
Data debt grows through three specific mechanisms:
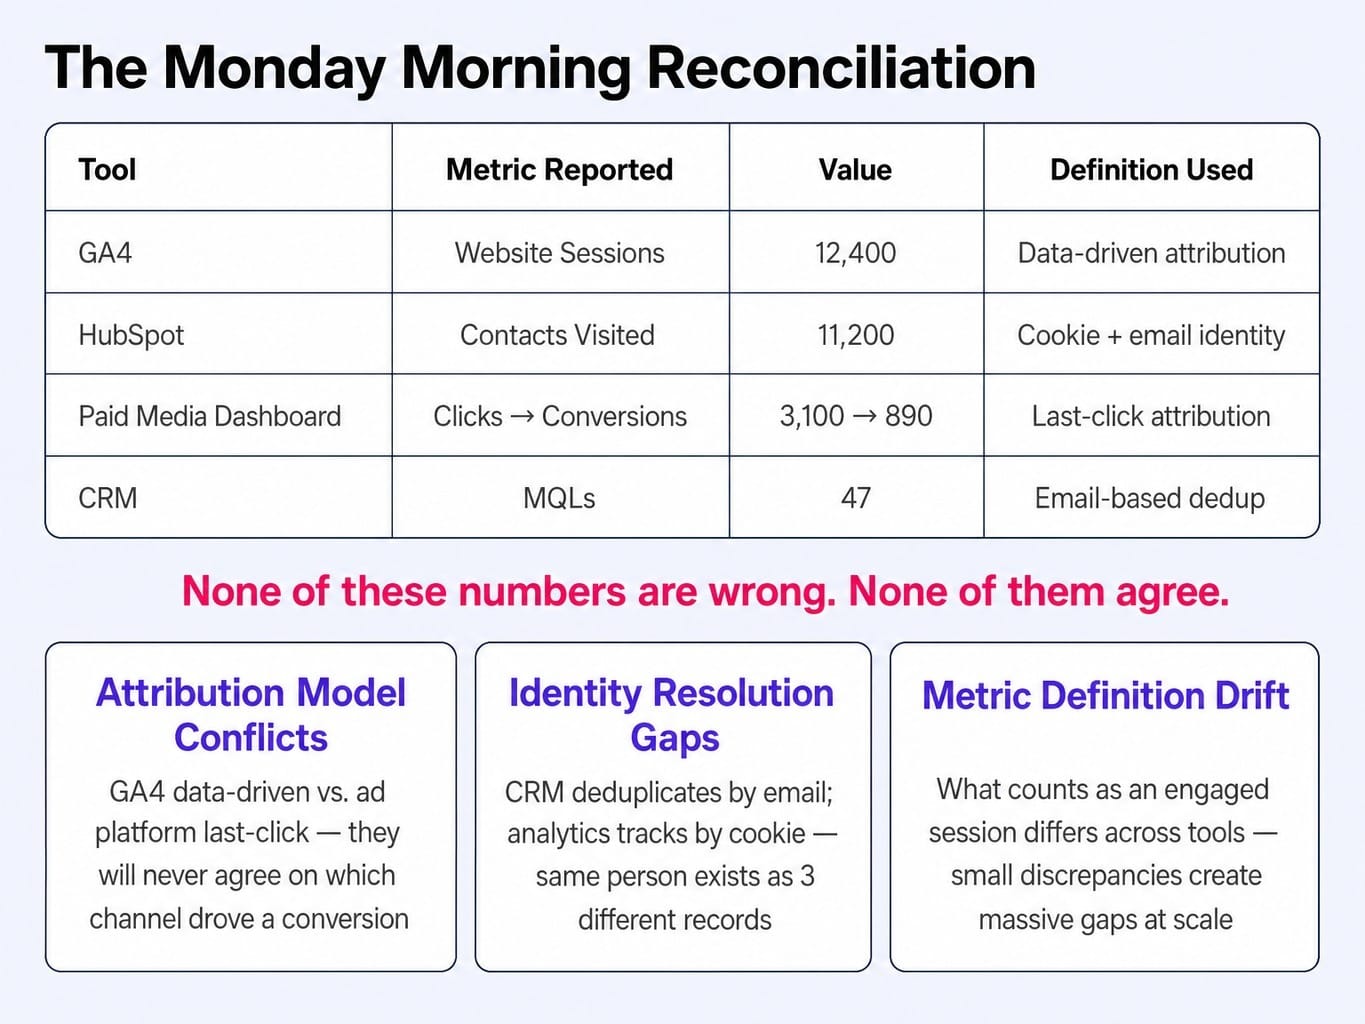
- Attribution Model Conflicts: GA4 uses data-driven attribution while your ad platform uses last-click. They will never agree on which channel drove a conversion, forcing you to pick a "source of truth" by convention, not confidence.
- Identity Resolution Gaps: Your CRM deduplicates by email while your analytics tool tracks by cookie. The same person can exist as three different records with three different activity histories across your stack.
- Metric Definition Drift: What counts as an "engaged session" in one tool is not what counts in another. These small discrepancies create massive reporting gaps at scale.
This is why teams get stuck performing stack archaeology—digging through tool configurations just to understand why the numbers diverge. That Monday morning reconciliation ritual isn't a reporting task; it's an interest payment on your data debt.
Read more: SaaS Marketing Metrics That Actually Inform Decisions (Not Just Dashboards)
Workflow Debt: The Manual Processes That Exist Only to Bridge Tool Gaps
Every Thursday, someone on your team exports a CSV from your webinar platform, reformats it in Google Sheets, deduplicates it against the CRM, and uploads the cleaned list to your email tool for the follow-up sequence. This takes 90 minutes. It has been happening every week for two years. Nobody has automated it because the tools don't natively integrate, and the last time someone tried to build a Zap for it, the field mapping broke. So the manual process stays.
This is workflow debt: the accumulated manual labor that exists solely to bridge the gaps between tools that do not natively communicate.
Workflow debt is the most invisible form of tool debt because it hides in people's calendars, not in software dashboards. No tool reports on it. It shows up as "busy work" that team members absorb without complaint because they've normalized it. This is where connector rot sets in, as manual bridges slowly degrade when tools update their UIs or change export formats.
The debt here calcifies around specific people rather than specific tools. Its compounding mechanism is dependency. Every manual process creates a reliance on the person who performs it. When that person goes on vacation or leaves, the process breaks, and the team discovers they've been running on institutional knowledge, not systems. The real question to uncover workflow debt is: "What would break if Sarah didn't come to work for two weeks?"
Why Marketing Tool Debt Compounds Faster Than You Expect
Marketing tool debt doesn't grow linearly—it compounds. Each new tool added to the stack doesn't just add its own debt; it multiplies the debt of every existing tool by creating new integration points, new data sources to reconcile, new features to learn, and new workflow gaps to bridge.
Consider the math. Adding one new tool to a stack of five doesn't create one new relationship; it creates five new potential failure surfaces. Each of those relationships is a potential source of integration, data, or workflow debt. This multiplicative effect is why software sprawl feels exponential.
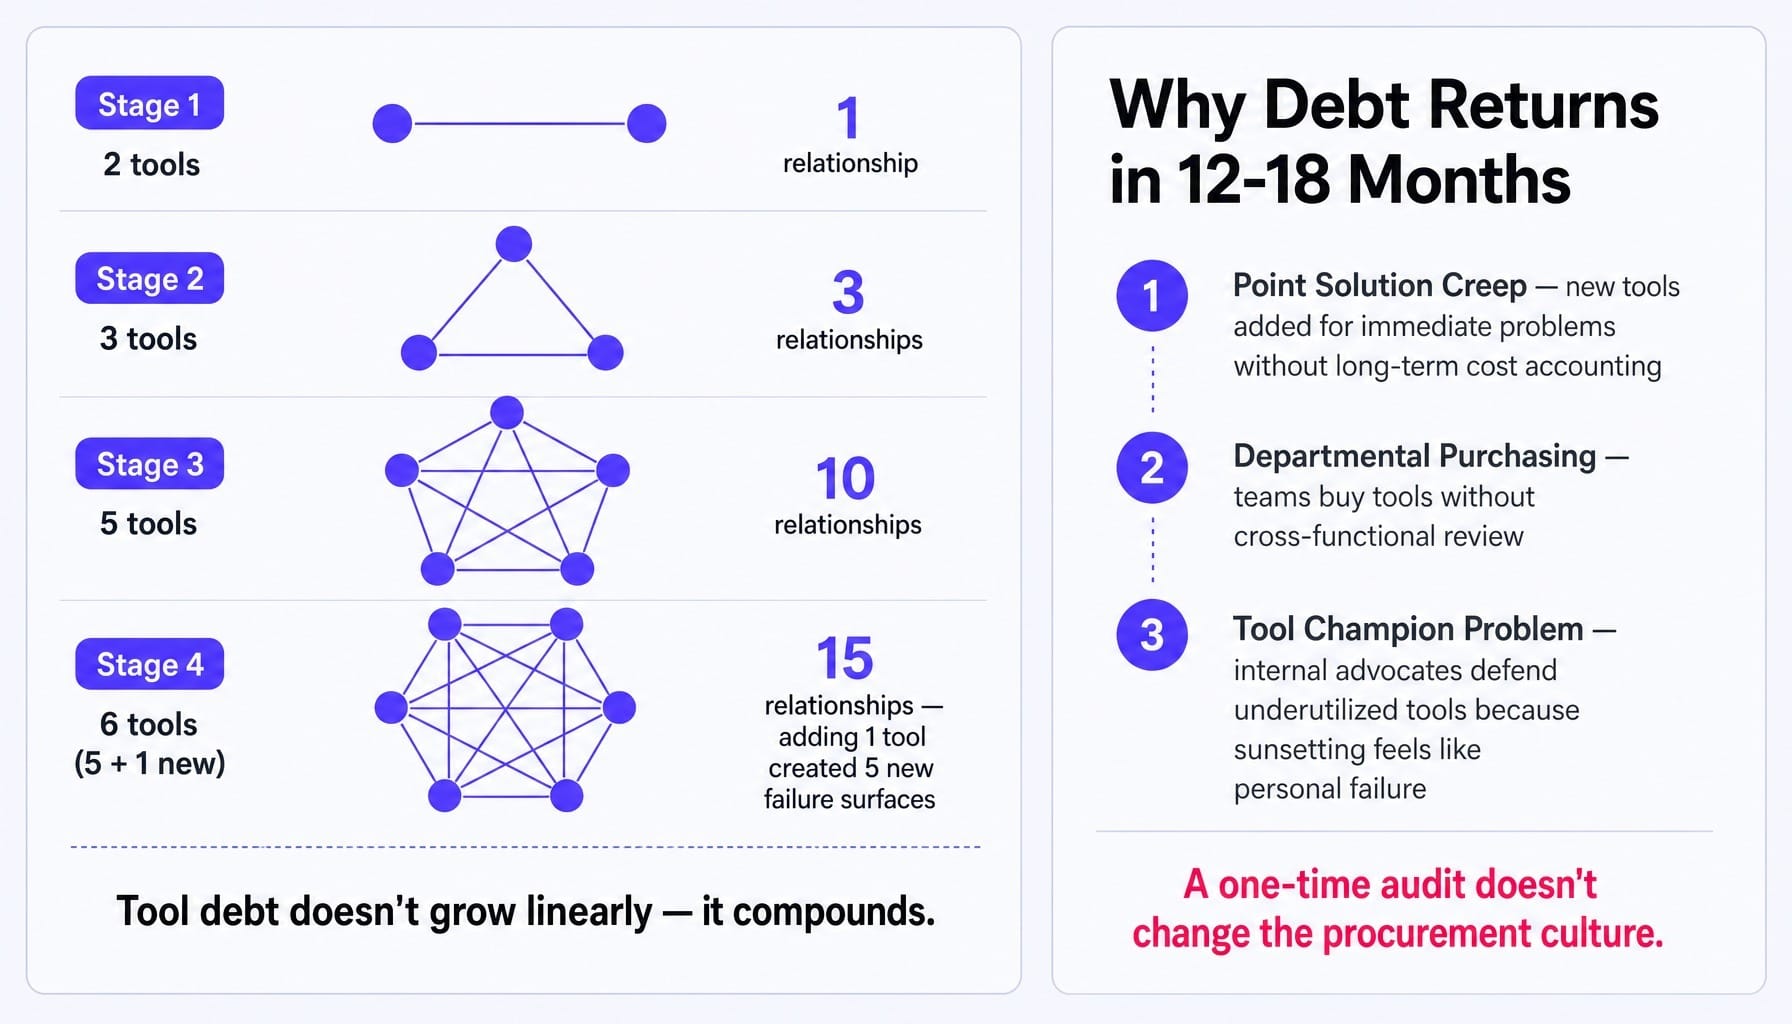
Even teams that successfully rationalize their stack often re-accumulate debt within 12-18 months. The forces that created the debt are structural, not episodic: point solution creep, departmental purchasing, and the tool champion problem—the internal advocate who defends a tool regardless of utilization because sunsetting it feels like a personal failure. A one-time audit doesn't change the procurement culture that allows shadow subscriptions to thrive. Without a fundamental shift, the debt always returns. Building a SaaS marketing stack that ships rather than just reports is the antidote to this cycle.
What If the Tool Actually Shipped the Fix?
The tension is clear: marketing tool debt accumulates because every tool in the stack adds another layer of diagnosis—another dashboard, another report, another recommendation—without closing the loop by actually implementing the change. The gap between "here is what you should do" and "it is done" is where all four types of debt live.
Integration debt exists because tools need connectors to talk. Learning debt exists because tools require configuration that never happens. Data debt exists because each tool creates its own version of truth. Workflow debt exists because tools leave the last mile to humans.
This is why the resolution isn't another diagnostic tool. It's a different kind of system entirely. Instead of adding a platform that surfaces what needs to change and then hands you homework, Spike AI identifies the highest-impact move across your website, SEO, and ads—and ships it. Weekly.
The reason tool debt compounds is that tools stop at diagnosis. The resolution is a system that doesn't stop there. When the tool itself ships the fix, the entire category of debt begins to collapse.
See how Spike AI replaces your tool debt with weekly shipped improvements →
The Real Cost Is in the Gaps
Marketing tool debt isn't a budget problem or a "too many tools" problem. It's a structural condition created by the gap between what tools surface and what your team can actually ship.
Every tool you add promises to solve a problem, but each one also introduces integration points, learning curves, data sources, and manual workflows that compound over time. The real debt isn't in the invoices. It's in the hours your team spends bridging the gaps between tools that were never designed to work as a system.
The next time you evaluate a marketing tool, don't ask what it can diagnose. Ask what it can ship.
Frequently Asked Questions
What is the difference between marketing tool debt and technical debt?
Technical debt refers to shortcuts in code that create future rework for engineers. Marketing tool debt is the operational analog: the accumulated cost of fragile integrations, unused features, siloed data, and manual workarounds across your martech stack. Crucially, technical debt lives in code and is visible to engineers, while marketing tool debt hides in calendars and tribal knowledge, making it harder to quantify.
How do I calculate the total cost of ownership for a marketing tool?
Add the subscription cost to four hidden costs: (1) integration setup and maintenance hours, (2) training and onboarding time, (3) hours spent reconciling its data with other tools, and (4) manual workflow hours required to bridge its gaps with the rest of your stack. Most teams find these hidden costs exceed the license fee within a year.
When should I consolidate marketing tools versus keeping best-of-breed?
Consolidate when the integration and workflow debt between best-of-breed tools exceeds the capability gap you would accept by moving to a platform. If your team spends more hours bridging tools than using their unique features, the best-of-breed advantage has been consumed by debt. Keep best-of-breed only when its unique capability directly drives revenue and the integration cost is genuinely low.
What role does shadow IT play in marketing tool sprawl?
Shadow IT—tools purchased by individuals or departments without centralized approval—is a primary driver of tool debt. These shadow subscriptions bypass procurement governance, create undocumented integrations, and introduce data silos that nobody else knows exist. Audit credit card statements and SSO logs quarterly to surface tools that entered the stack without cross-functional review.
What KPIs should I track to measure marketing tool debt reduction?
Track four metrics: license utilization rate (% of paid features actively used), manual workflow hours per week (time spent on bridging tool gaps), data reconciliation time (hours spent aligning dashboards), and integration maintenance incidents per month (how often a connector or webhook breaks). Improvement in these four signals that debt is decreasing.