Pipeline Marketing in 2026: The Framework, Metrics, and Mistakes That Shape Revenue
TL;DR
- Stop celebrating raw pipeline coverage ratios. A 4x coverage can easily mask an under-covered pipeline if you don't stage-weight it by historical conversion rates.
- Your dashboard is likely filled with lagging indicators (MQLs, closed-won). Shift focus to leading indicators like pipeline decay and stage-skip rate to predict where your pipeline will break before it happens.
- Calculate pipeline velocity: (Opportunities × Deal Value × Win Rate) ÷ Sales Cycle. It's the single most important composite metric for predicting revenue performance.
- Linear pipeline stage models fail against modern buying committees. Track engagement breadth (how many stakeholders are active) and intent signals, not just the primary contact's stage.
- Distinguish between marketing-sourced pipeline (what marketing created) and marketing-influenced pipeline (what marketing touched). Reporting the latter often inflates contribution and hides performance issues.
A B2B SaaS marketing team reports 2,400 MQLs last quarter. The number goes into the board deck, and the team celebrates hitting its target. Three months later, sales has closed 11 deals from that cohort—a 0.46% conversion rate. The CMO asks which campaigns drove those 11 deals, and nobody can answer with confidence.
This is the state of play in countless B2B marketing departments. Success is measured by the volume entering the top of the funnel, not by what exits the bottom as revenue.
Pipeline marketing is the practice of measuring and optimizing marketing by its direct contribution to revenue-generating pipeline, not by lead volume. It's a shift from activity reporting to revenue accountability. But it demands more than a new dashboard; it requires a different operating system. This guide covers what pipeline marketing actually requires operationally—the metrics that predict conversion, the measurement mistakes that distort pipeline health, and why linear models break against modern buying committees.
Pipeline marketing measures revenue contribution, not lead volume
Pipeline marketing is a B2B strategy that evaluates every marketing activity by its measurable contribution to qualified pipeline and closed revenue, rather than by lead volume, impressions, or engagement metrics. This isn't a conceptual shift; it's an operational one. Instead of asking, "How many leads did this campaign generate?" the pipeline marketer asks, "How much qualified pipe gen did this campaign source or influence, and what was the cost per opportunity?"
The gap isn't in understanding the concept. It's in the operational commitment. A survey found that 61% of marketers avoid using ROI in their own decisions, despite pressure to prove it. This happens because true pipeline marketing requires infrastructure: closed-loop reporting between a CRM like Salesforce or HubSpot and marketing systems, shared definitions of pipeline stages between sales and marketing, and attribution that connects first-touch through closed-won. Teams that want to build this foundation should start with a clear marketing ROI framework that connects spend to revenue outcomes.
For example, a webinar that generated 340 leads is an activity metric. Under a pipeline marketing model, the evaluation becomes: the webinar sourced $180K in qualified pipeline, of which $45K has closed. This discipline also forces a crucial distinction between marketing-sourced pipeline (marketing created the opportunity) and marketing-influenced pipeline (marketing touched an opportunity that sales or another channel originated). One measures creation; the other measures acceleration.
Pipeline marketing and lead generation solve fundamentally different problems
Lead generation is a tactic; pipeline marketing is a measurement and optimization discipline. They are not alternatives. Lead gen fills the top of the pipeline, but pipeline marketing evaluates whether what enters the top actually converts to revenue at the bottom. The fact that 80% of new leads never convert to sales is a direct indictment of measuring lead volume in isolation.
Activity theater in pipeline reporting doesn't just waste executive attention; it actively misallocates budget by rewarding marketing programs that produce visible motion (MQLs created, sequences launched) over programs that cause stage progression. Teams adopting tools for conversion optimization on the website layer are already acknowledging that human-speed measurement and adjustment cycles cannot keep pace with the complexity of modern buying behavior.
Read more: B2B SaaS Lead Generation Strategies That Scale Pipeline, Not Just Lead Counts | Spike AI
Consider a content syndication campaign that generates 800 leads at $22 CPL. The lead gen team celebrates a win. Pipeline analysis, however, reveals only 14 of those leads entered the pipeline (a 1.75% SAL-to-SQL conversion rate), and just two eventually closed for a total of $38K in ACV. The true cost per customer was $8,800. Under lead gen metrics, the campaign was a success. Under pipeline marketing metrics, it was an inefficient use of budget that should be reallocated. Pipeline marketing doesn't replace lead generation; it reframes how you evaluate its business impact.
Why pipeline coverage ratios mislead without stage-weighted analysis
The pipeline coverage ratio—typically expressed as 3x or 4x of quota—is the most commonly cited pipeline health metric in B2B SaaS, and it is routinely misleading. Most teams calculate it by dividing total pipeline value by the revenue target. A team with $4M in pipeline against a $1M target reports 4x coverage and feels safe. But this number treats a discovery-stage opportunity identically to a verbal-commit-stage opportunity, which distorts the signal entirely. Raw pipeline coverage is a vanity metric unless it accounts for stage-weighted conversion probabilities.
The standard coverage ratio treats all pipeline stages as equal
The 3x–4x pipeline coverage multiple is calculated with simple division: total open pipeline value divided by the revenue target. It became a default metric because it's simple and fits on a slide. The flaw, however, is fundamental. I once rebuilt a pipeline model where a reported 4.2x coverage ratio was masking the fact that nearly half the pipeline value sat in stages where historical conversion rates were below 5%. The forecast was built on deals that had almost no statistical chance of closing.
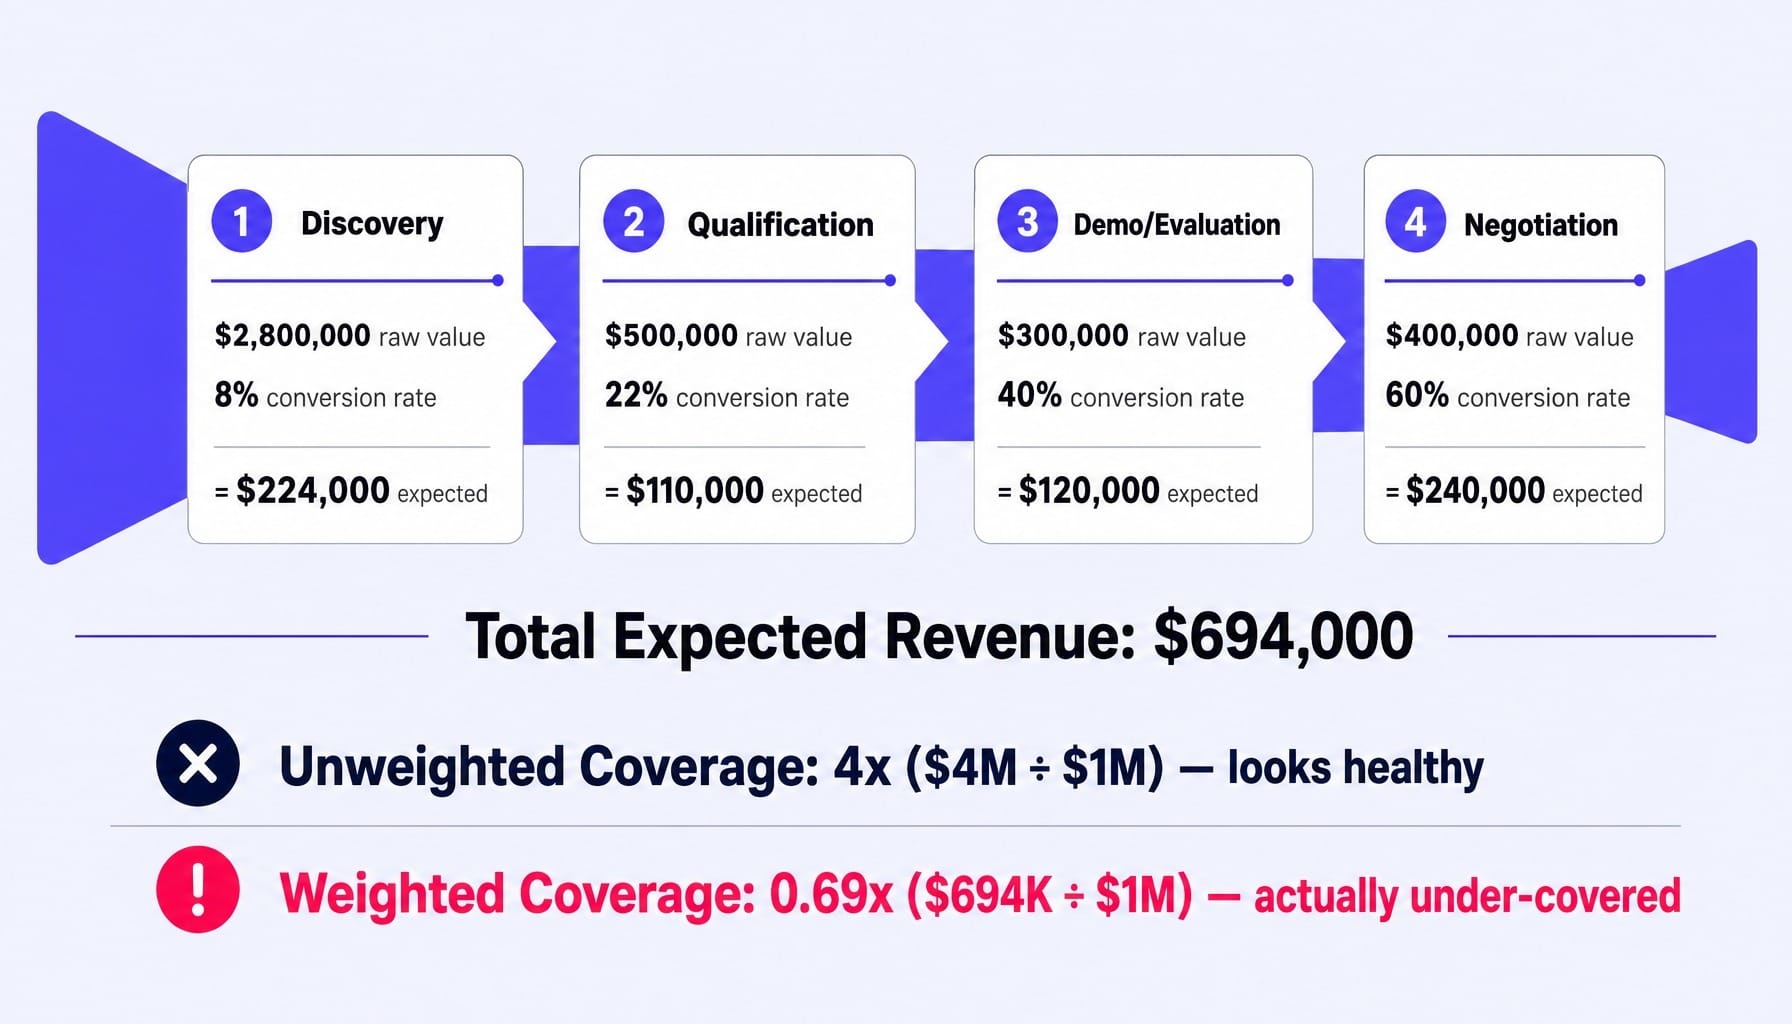
Let's use the $4M pipeline against a $1M target. The 4x coverage looks healthy. But if $2.8M of that pipeline is in the "Discovery" stage (with an 8% historical close rate) and only $400K is in "Negotiation" (with a 60% close rate), the actual expected revenue from that pipeline is far less than the target. The unweighted coverage ratio creates a false sense of security that leads directly to end-of-quarter misses. Understanding which SaaS marketing benchmarks apply to your stage and motion is critical to setting realistic coverage targets.
Stage-weighted pipeline gives you an honest forecast
The corrected approach is to calculate your ACV-weighted pipeline. You multiply each stage's pipeline value by its historical conversion rate to get its expected revenue contribution, then sum the results across all stages. This gives you an honest forecast.
Using the same $4M pipeline example with stage weights applied:
- Discovery: $2,800,000 × 8% = $224,000
- Qualification: $500,000 × 22% = $110,000
- Demo/Evaluation: $300,000 × 40% = $120,000
- Negotiation: $400,000 × 60% = $240,000
Total Expected Revenue: $694,000
Against a $1M target, the team is actually under-covered. They need to generate more pipeline or accelerate existing deals, not celebrate 4x coverage. Teams should calculate this stage-weighted coverage weekly, using tools like Clari or building reports directly in their CRM, and set pipeline creation targets based on this weighted number, not the raw total.
The metrics that actually predict pipeline-to-revenue conversion
Most pipeline marketing dashboards over-index on lagging indicators (closed-won revenue, total pipeline value) and under-index on leading indicators that predict future performance. Lagging indicators tell you what already happened; they're useful for reporting but useless for intervention. Leading indicators tell you where the pipeline is about to break, giving you time to act. A team tracking total pipeline value (lagging) but ignoring pipeline decay (leading) might report a healthy pipeline in week 4, only to see it collapse by week 8 because 30% of their qualified opportunities went dark.
Leading indicators tell you where the pipeline will break
Leading indicators are the early warning system for your revenue engine. They predict future pipeline health before it shows up in closed-won numbers. The four most important are:
- MQL-to-Opportunity Conversion Rate: If this metric drops, your pipeline creation will decline 4–6 weeks later. It's the canary in the coal mine for top-of-funnel quality and sales alignment.
- Stage-Skip Rate: When opportunities jump from "Discovery" straight to "Proposal" without proper qualification, it signals a process breakdown. This inflates pipeline value temporarily but dramatically increases the late-stage loss rate.
- Pipeline Decay: This is the percentage of pipeline that goes dark (no meaningful activity for 14+ days) in a given period. A rising decay rate is a direct predictor of future pipeline shrinkage and missed forecasts.
- Pipeline Creation vs. Consumption Rate: If you're closing deals faster than you're creating new qualified pipeline, you're drawing down a finite resource and heading for a future shortfall.
Read more: SaaS Marketing Metrics That Actually Inform Decisions (Not Just Dashboards) | Spike AI
Pipeline velocity is the composite metric that ties everything together
Pipeline velocity is the single most important composite metric in pipeline marketing. It captures four dimensions of pipeline health simultaneously: volume, value, efficiency, and speed.
The formula is:
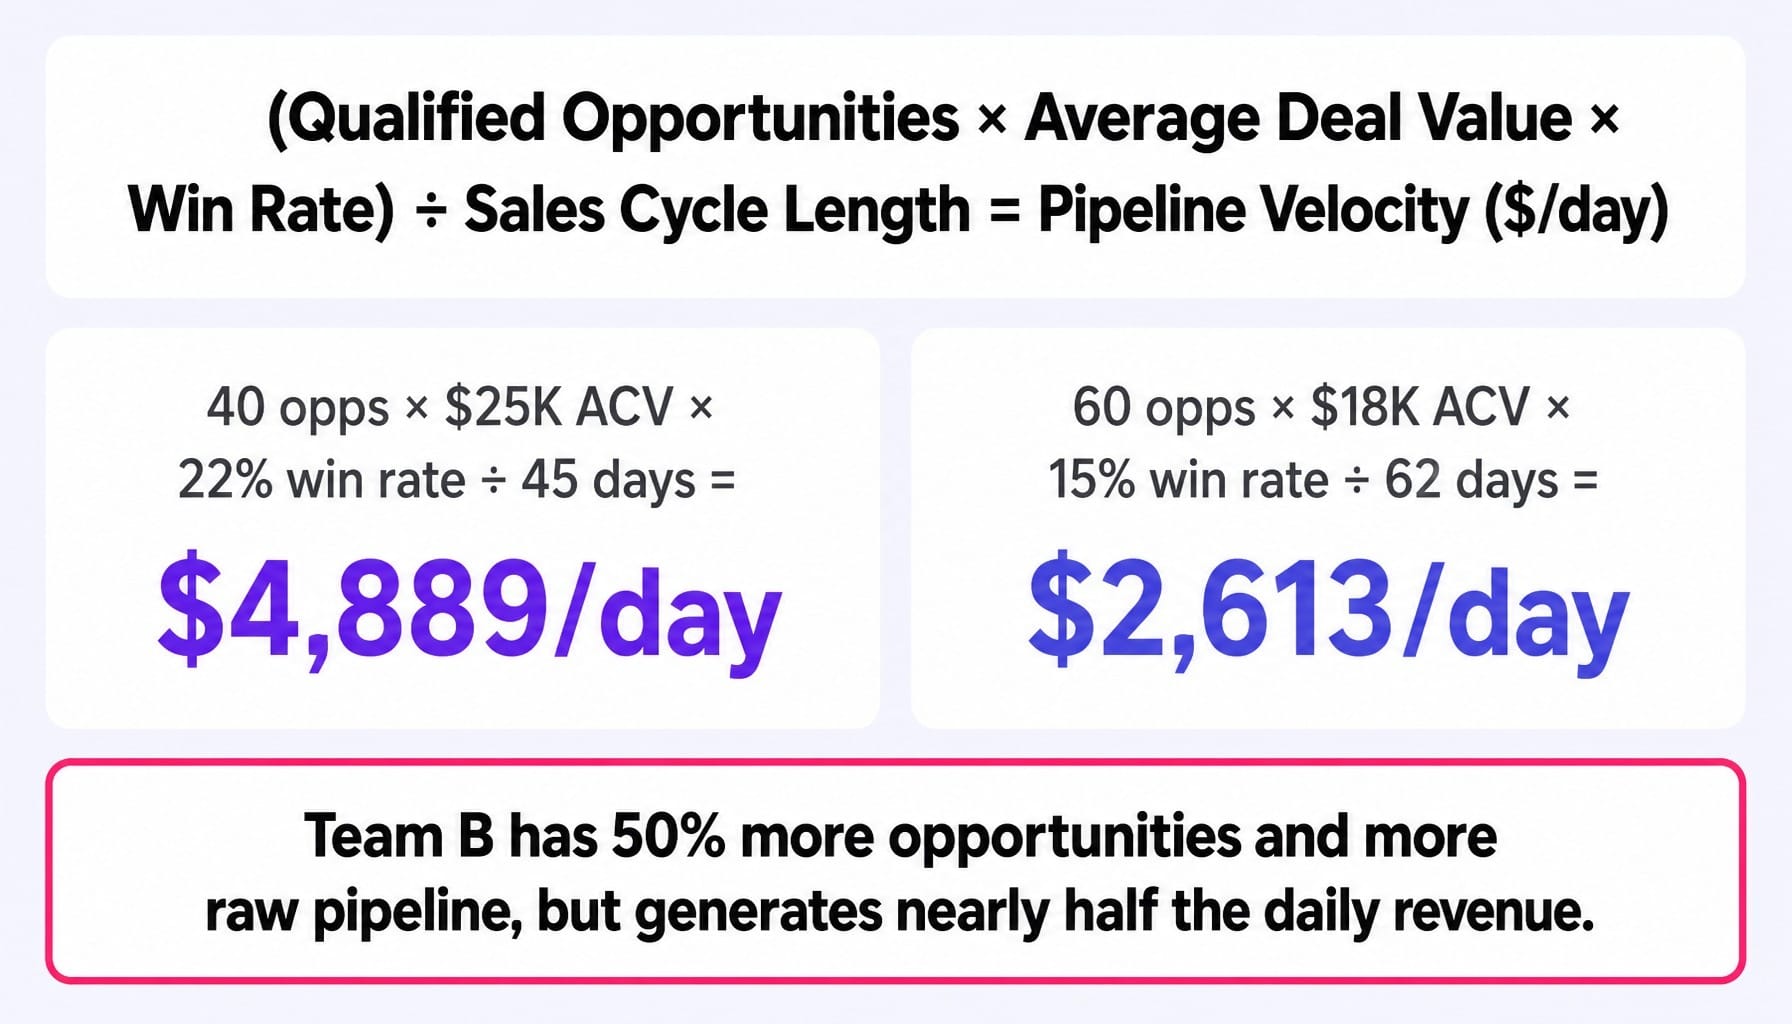
(Number of Qualified Opportunities × Average Deal Value × Win Rate) ÷ Average Sales Cycle Length (in days)
This metric tells you how much revenue your pipeline is generating per day. Consider two teams:
- Team A: 40 qualified opps × $25K ACV × 22% win rate ÷ 45-day cycle = $4,889/day
- Team B: 60 qualified opps × $18K ACV × 15% win rate ÷ 62-day cycle = $2,613/day
Team B has more opportunities and more raw pipeline value, but their velocity is nearly half that of Team A. They will underperform. Tracking the trend line of your pipeline velocity is more predictive of future revenue than looking at a static pipeline coverage multiple. Tools like HockeyStack or Dreamdata can help automate this calculation by connecting CRM data with marketing touchpoints across the full funnel.
Pipeline models break when buying committees don't move linearly
According to Gartner, B2B buying groups involve 6–10 decision-makers, each independently consuming content and forming opinions. These stakeholders enter the buying process at different times, revisit earlier stages, and influence each other non-linearly. Yet, most pipeline models—Awareness → Qualification → Proposal → Close—assume a single buyer moving through a neat sequence.
This is where the model breaks. The economic buyer might be in evaluation while a technical user is still in awareness, and the champion who initiated the process has already moved to internal negotiation. A CRM that only tracks the opportunity stage object, not the engagement of individual contacts, will report this deal as "stalled" in qualification. In reality, it's actively progressing—just not along the linear axis the CRM tracks. Most CRM implementations treat opportunity stage as a property of the deal object, not of the individual contacts on the deal, which makes these buying committee dynamics invisible.
The consequence is that teams misdiagnose active deals as stalled and either deprioritize them or apply the wrong acceleration tactics. To fix this, you need two adjustments:
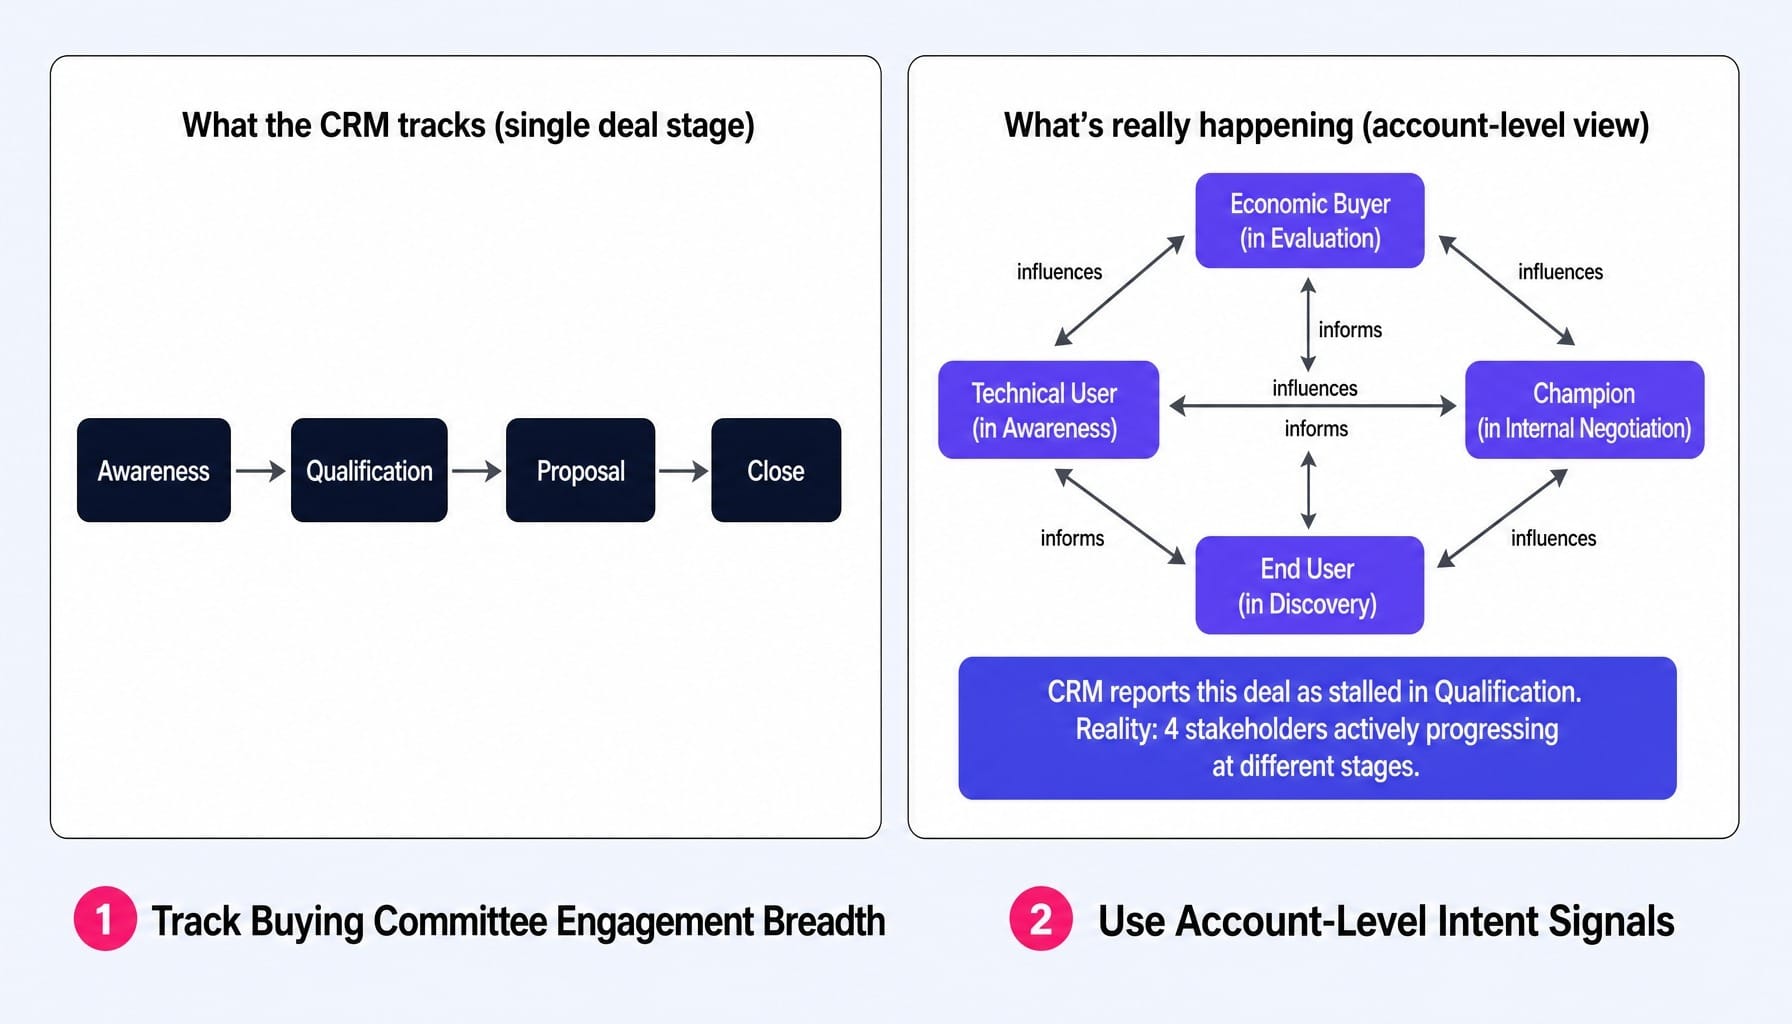
- Track Buying Committee Engagement Breadth: Measure how many distinct stakeholders from the target account have engaged, not just the primary contact's activity.
- Use Account-Level Intent Signals: Monitor signals from tools like 6sense, Demandbase, or Common Room to detect account-wide research activity that the CRM contact record doesn't capture. This helps illuminate the "dark funnel"—buying activity happening in channels you can't track, like Slack communities or peer conversations.
Most pipeline dashboards measure activity theater, not revenue causation
The average B2B marketing pipeline dashboard is a retrospective activity report dressed up as a revenue forecast. It shows MQLs created, demos scheduled, and total pipeline value—all lagging indicators that describe what already happened. What it rarely shows is which specific marketing actions caused the pipeline to move forward or where conversion friction is actively destroying value right now.
A marketing team presents a dashboard showing $3.2M in "marketing-influenced pipeline." The CTO asks, "Which of these deals would not have happened without marketing?" The room goes quiet. This is the attribution inflation problem. Marketing-influenced pipeline—which can count any deal where marketing touched any contact, regardless of whether that touch mattered—is often 3–5x larger than marketing-sourced pipeline. Reporting the bigger number creates a false sense of contribution.
The real value of a pipeline dashboard isn't reporting what happened; it's identifying what to do next. It should surface the highest-impact optimization opportunity across the funnel: which landing page has the highest drop-off rate for qualified visitors? Which nurture sequence has the highest pipeline decay? Which channel sources opportunities with the highest pipeline velocity? Most teams don't have this because building it requires continuous analysis across CRM, website, and channel data—not a quarterly dashboard refresh. This is the same B2B demand generation challenge: the strategy isn't the problem—shipping speed is.
When pipeline optimization requires continuous action, not quarterly reviews
The core tension of modern pipeline marketing is clear: success requires continuously identifying the highest-impact optimization across your funnel and acting on it before the next pipeline review. But for most lean marketing teams, the gap between identifying what needs to change and actually shipping that change—through discussions, planning, approvals, and execution—stretches into weeks or months. This execution latency is where pipeline value is lost.
Spike AI operates as a pipeline optimization layer that closes this gap. Our system continuously analyzes website conversion paths, content performance, and funnel friction points to identify the single move with the highest projected impact on qualified pipeline. Then, we help you ship that fix every week. This transforms the function of measurement from a quarterly reporting exercise into a continuous optimization engine. It's the difference between a pipeline dashboard that reports what happened and a system that acts on what should happen next.
From Framework to Discipline
The most important shift is recognizing that pipeline marketing is not a framework you adopt—it's a measurement and optimization discipline that requires continuous operational commitment. Most teams understand the concept but undermine it with unweighted coverage ratios, lagging-indicator dashboards, and linear models that don't reflect how buying committees actually behave.
The teams that win at pipeline marketing are the ones that close the gap between measurement and action. They identify the highest-impact optimization and ship the fix before the next pipeline review, not after. The question for your team isn't whether you understand pipeline marketing. It's whether your operational cadence is fast enough to act on what your pipeline data is telling you.
Frequently Asked Questions
Can pipeline marketing work without a CRM?
Technically, it's possible for very small companies, but it's operationally impractical. Pipeline marketing requires closed-loop reporting that connects marketing touches to pipeline stages and revenue. Without a CRM like HubSpot or Salesforce tracking deal progression, you cannot calculate pipeline velocity, stage conversion rates, or sourced vs. influenced attribution. Spreadsheet-based tracking breaks down quickly and cannot provide the necessary insights.
How do you set pipeline creation targets for the marketing team?
You should reverse-engineer them from the company's revenue target. If the quarterly revenue goal is $500K, the average deal size is $25K, and the historical win rate from qualified pipeline is 20%, then you need to generate $2.5M in qualified pipeline. From there, apply your stage-weighted conversion rates to determine how much top-of-funnel activity is required to hit that number.
What is the difference between sourced and influenced pipeline attribution?
Sourced pipeline means marketing created the opportunity; the first meaningful engagement came from a marketing channel. Influenced pipeline means marketing touched a contact associated with an opportunity that originated elsewhere (e.g., sales outbound). Most teams report influenced pipeline because the number is larger, but sourced pipeline is the more honest measure of marketing's direct contribution to revenue. Track both, but set targets based on sourced.
How does pipeline marketing integrate with account-based marketing (ABM)?
They are complementary. ABM is a strategy for selecting and prioritizing target accounts. Pipeline marketing provides the measurement framework to evaluate whether ABM investments are generating qualified pipeline and closed revenue, not just engagement metrics. ABM narrows the aperture to high-value accounts, and pipeline marketing tells you if your efforts against those accounts are actually working.
How do you report pipeline marketing results to the C-suite?
Lead with three numbers: marketing-sourced pipeline created, pipeline-to-revenue conversion rate, and cost per opportunity. Avoid vanity metrics like MQL counts. Executives care about revenue contribution and efficiency. Show the trend line across quarters, not just a single snapshot. If possible, include pipeline velocity as a composite health metric that captures volume, value, win rate, and cycle length in one number.