
SaaS LTV Explained: 5 Calculation Methods, Worked Examples, and Why Your Number Is Probably Wrong

TLDR
- Always use gross-margin-adjusted LTV for decisions. Revenue-based LTV inflates the metric and leads to overspending on customer acquisition.
- A single, blended LTV is a vanity metric. Segment LTV by acquisition channel, pricing tier, and cohort to find hidden inefficiencies and profitable growth pockets.
- The standard LTV formula breaks with negative churn or usage-based pricing. In these cases, you must cap the customer lifetime or use cohort-based analysis for an accurate picture.
- A healthy LTV:CAC ratio is 3:1 or higher, but only if your CAC payback period is under 12 months. Investors care as much about the speed of payback as the total value.
- LTV is not a reporting metric; it's a capital allocation framework. Use segmented LTV to decide where to shift marketing spend and retention efforts in real time.
SaaS Customer Lifetime Value (LTV) estimates the total gross profit a single customer account will contribute across the full duration of their subscription. It serves as the primary unit-economics metric for gauging customer profitability and setting the ceiling on customer acquisition cost (CAC).
But here's the problem: most teams calculate LTV once, report it on a board slide, and never use it to make an actual decision. They're doing arithmetic, not strategy.
A single, blended LTV figure is a vanity metric. The companies that grow fastest treat LTV as a dynamic decision-making instrument. They recalculate it continuously, segment it relentlessly, and use it to allocate capital. This guide covers the five calculation methods you need to know, shows why blended LTV misleads using a single worked dataset, and explains how to turn LTV from a number on a slide into your most powerful capital allocation tool.
What Is SaaS Customer Lifetime Value?
Customer Lifetime Value (LTV, also called CLV) is the predicted gross profit a customer will generate for your business over the entire time they remain a paying subscriber. It's a forward-looking metric that answers the question: "Based on current behavior, how much profit can we expect from this customer before they churn?"
The critical distinction is that LTV is based on gross profit, not total revenue. A customer generating $50,000 in annual recurring revenue but costing $35,000 in hosting, support, and onboarding has an LTV based on the $15,000 contribution margin, not the $50,000 top-line figure.
This isn't just a financial nuance; it's the core of the metric's utility. LTV is not a number you calculate—it's a lens you apply to every acquisition, pricing, and retention decision, and it changes every time your churn rate, expansion revenue, or cost structure shifts.
How to Calculate SaaS LTV
The standard SaaS LTV formula is ARPA × Gross Margin ÷ Customer Churn Rate.
LTV = (ARPA × Gross Margin %) / Customer Churn Rate
- ARPA (Average Revenue Per Account): The average monthly or annual revenue you generate from a single customer.
- Gross Margin %: Your revenue minus Cost of Goods Sold (COGS), which includes expenses like hosting, third-party software fees, and customer support salaries.
- Customer Churn Rate: The percentage of customers who cancel their subscriptions in a given period (monthly or annually). The inverse of this (1 / Churn Rate) represents the implied customer lifetime.
To see how different calculation methods affect the final number, let's use a single, consistent example: NovaCRM, a fictional B2B SaaS company with the following metrics:
- ARPA: $450/month
- Gross Margin: 80%
- Monthly Logo Churn: 2.3%
- Monthly Expansion MRR Rate: 1.1%
- Q1 New Customers: 85
> Critical Warning: Match Your Time Periods
> Your ARPA and churn rate must use the same time period. If you use monthly ARPA, you must use monthly churn. Mismatching a monthly churn rate with an annual ARPA (or vice-versa) will inflate or deflate your LTV dramatically.
> For example, using NovaCRM's monthly churn of 2.3% as if it were an annual figure would yield an LTV of $15,652. But the correct annual churn is 1 - (1 - 0.023)^12 ≈ 24.5%. Using this correct annual figure with an annualized ARPA of $5,400 results in the same LTV. Using the wrong time period is one of the most common and dangerous LTV calculation mistakes.
Simple LTV Formula
The most basic LTV formula ignores gross margin and provides a quick, revenue-based estimate.
Simple LTV = ARPA / Customer Churn Rate
For NovaCRM, this calculation is:
$450 / 0.023 = $19,565
This formula is useful for back-of-the-napkin math or for very early-stage companies with less than six months of data and unstable gross margins. However, because it ignores the cost to serve the customer, it significantly overstates the actual profit you can expect. This version should never appear in a board deck, investor report, or be used for any capital allocation decisions.
Gross-Margin-Adjusted LTV (Industry Standard)
This is the formula that matters. It adjusts for the cost of delivering your service, reflecting the actual profit contribution per customer.
Gross-Margin-Adjusted LTV = (ARPA × Gross Margin %) / Customer Churn Rate
For NovaCRM, the industry-standard calculation is:
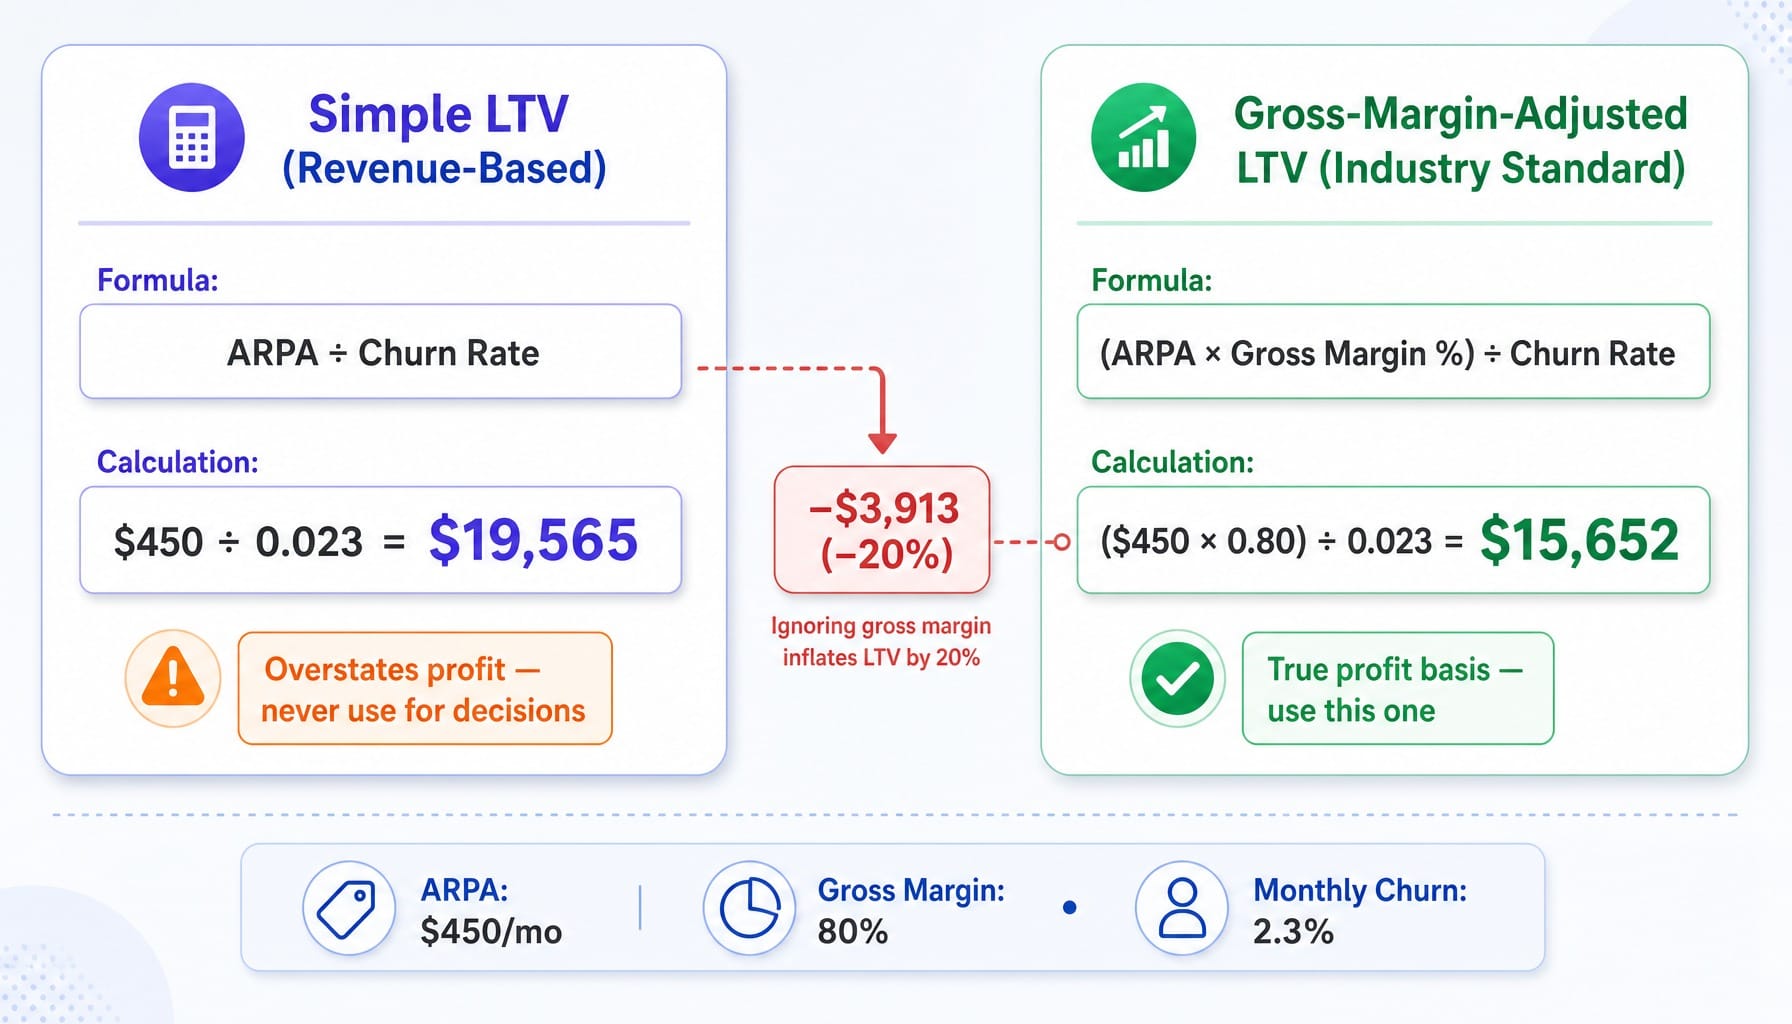
($450 × 0.80) / 0.023 = $15,652
This figure is the only honest basis for comparing against your Customer Acquisition Cost (CAC). Investors and experienced SaaS CFOs will always ask for this version. Teams that use the simpler, revenue-based LTV to justify high CAC spend often discover their payback period is dangerously long because their true contribution margin is lower than they assumed. This is the number you should use for all strategic decisions.
Cohort-Based LTV
Cohort-based LTV isn't another formula; it's the ground truth. It tracks the actual cumulative gross profit generated by a specific group of customers acquired in the same period (e.g., the "Q1 2024 Cohort").
Instead of relying on averaged inputs, you sum the actual, evolving revenue from that cohort month over month.
For NovaCRM, the Q1 cohort of 85 customers generated $38,250 in their first month. But by month 12, after some customers churned, others downgraded, and a few expanded to higher tiers, that same cohort might only be generating $31,500. By tracking their actual cumulative gross profit over 12, 24, or 36 months and dividing by the initial 85 customers, you get the true LTV.
Let's say after 24 months, NovaCRM's Q1 cohort analysis shows a cumulative gross profit per customer of $13,890. This is lower than the $15,652 the formula predicted. This gap tells you that your churn or contraction MRR assumptions in the formula were too optimistic. Cohort analysis, often automated with tools like ChartMogul or ProfitWell by Paddle, is the validation mechanism for every formula-based LTV.
The Gross Margin Adjustment Most Teams Skip
Revenue-based LTV is the most common calculation mistake in SaaS, and it consistently leads to overspending on acquisition. It feels better to report a higher number, but it masks fundamental issues in your unit economics.
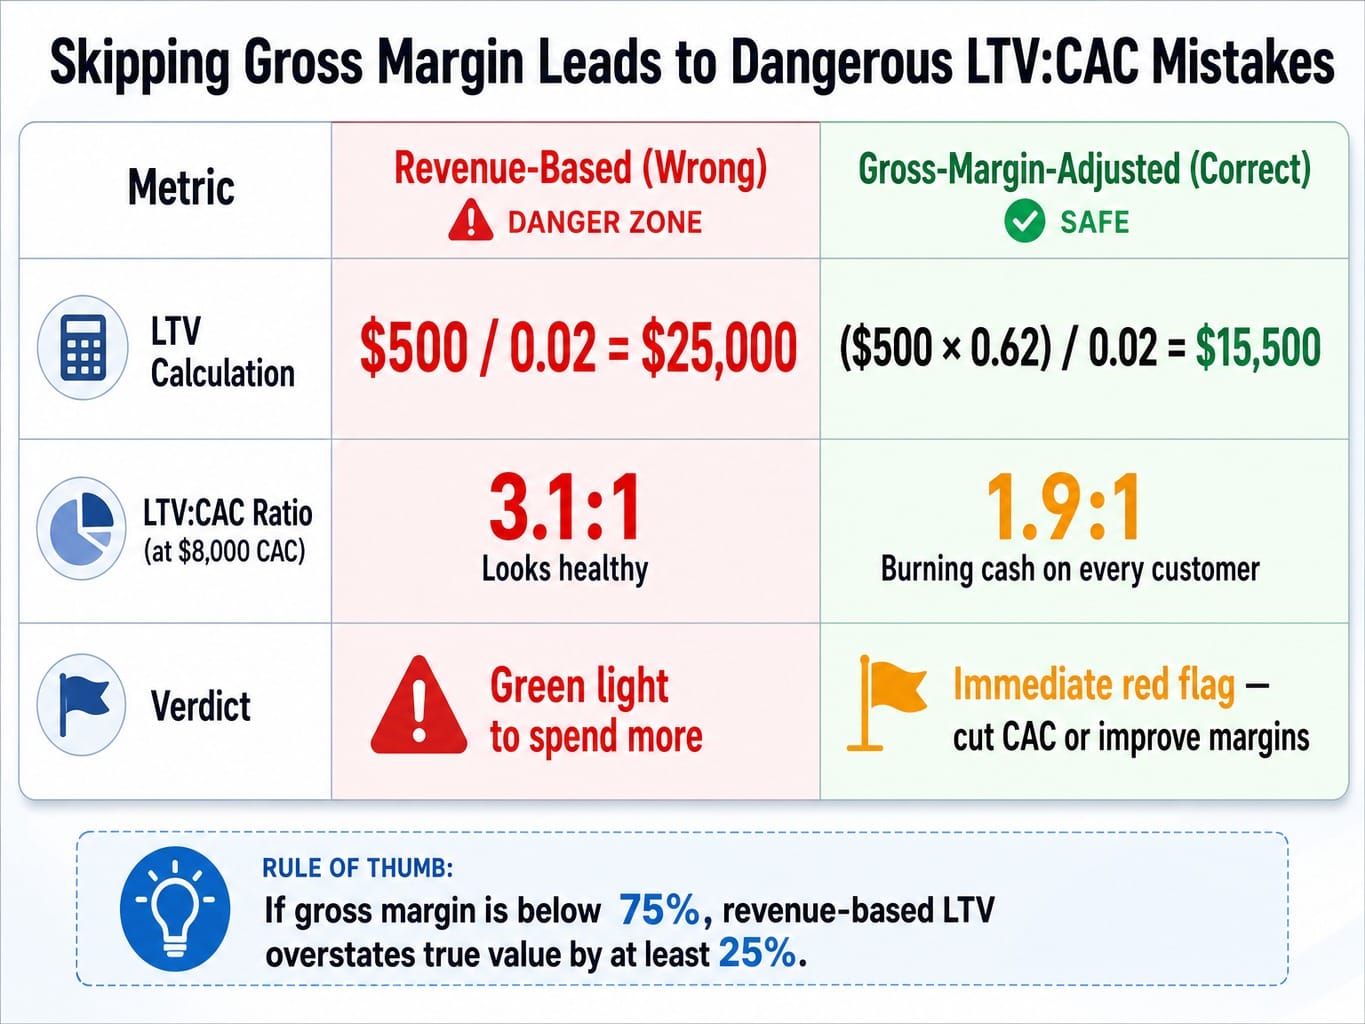
Consider a SaaS company with a $500 ARPA and a 2% monthly churn rate. Using the simple formula, they calculate their LTV as $25,000. Believing they have a healthy 3.1:1 LTV:CAC ratio, they set their target CAC at $8,000.
But their gross margin is only 62%; they have heavy infrastructure costs and require a high-touch support team.
Their real, gross-margin-adjusted LTV is:
($500 × 0.62) / 0.02 = $15,500
Their actual LTV:CAC ratio isn't 3.1:1. It's a dangerously low 1.9:1. They are burning cash on every single customer they acquire, all while reporting a "healthy" LTV to their board.
This isn't a theoretical edge case; it's a common scenario for SaaS businesses with complex infrastructure, data processing, or significant onboarding and support costs.
Rule of thumb: If your gross margin is below 75%, revenue-based LTV overstates your true customer value by at least 25%. You should never use it for spend decisions. This is precisely why investors and acquirers increasingly demand gross-margin-adjusted LTV specifically.
When Simple LTV Formulas Break: Negative Churn, Usage-Based Pricing, and DCF
The standard LTV formula assumes churn is positive, pricing is fixed, and a dollar today equals a dollar in three years. In modern SaaS, all three assumptions are frequently wrong. Here are three scenarios where the simple formulas produce misleading or mathematically impossible results.
Negative Churn and the Infinite LTV Trap
When expansion revenue from existing customers (upsells, cross-sells, seat additions) is greater than the revenue lost to churn and downgrades, your Net Revenue Retention (NRR) exceeds 100%. This means your net churn becomes negative.
In the standard formula LTV = (ARPA × GM) / Churn, a negative denominator produces a negative or infinite result. For NovaCRM, if their expansion MRR was 2.5% against a gross churn of 2.3%, their net churn would be -0.2%. The formula breaks.
This is mathematically correct but practically useless.
The Resolution: You have two options. First, you can cap the customer lifetime at a realistic duration, typically 5-7 years for B2B SaaS, and calculate LTV based on that fixed period. Second, and more accurately, you must rely on cohort-based LTV, which tracks actual cumulative revenue and isn't dependent on a formulaic lifetime. Companies with strong NRR (above 110%) must use cohort methods to have a credible LTV.
LTV Under Usage-Based and Hybrid Pricing
Usage-based and consumption-based pricing models break the "Average Revenue Per Account" (ARPA) assumption in the standard formula. If a customer pays $200 in a low-usage month and $800 in a high-usage month, there is no stable ARPA.
Averaging revenue across all customers can be misleading, as a few power users can skew the entire metric.
The Resolution: Instead of a single blended ARPA, calculate LTV using a trailing 6-month or 12-month ARPA to smooth out volatility. A better approach is to calculate LTV for separate customer segments based on their usage tiers (e.g., "low," "medium," "power user") and weight the final LTV by customer distribution. For hybrid models with a base subscription plus overages, calculate LTV on the stable subscription portion and model the variable usage component separately.
DCF-Adjusted LTV: When Time Value of Money Matters
Standard LTV treats a dollar received in year four the same as a dollar received today. This overstates the present value of long-lived customers. A discounted cash flow (DCF) approach applies a discount rate to future cash flows to account for risk and the time value of money.
While the full formula is complex, the concept is simple: future profit is worth less than profit today. For NovaCRM, their standard LTV of $15,652 might become ~$11,200 when applying a 15% annual discount rate.
When does this matter? DCF-adjusted LTV is critical for fundraising, M&A valuation, and strategic finance decisions where you compare long-term value to large, upfront capital expenditures. For day-to-day operational marketing decisions, the undiscounted, gross-margin-adjusted LTV is usually sufficient for comparing the relative value of different channels or segments.
Why Blended LTV Is a Vanity Metric: Segment Your Lifetime Value
A single company-wide LTV number is as useful as a single company-wide conversion rate—it tells you nothing about where to invest or what to fix. It's an average that hides the truth.
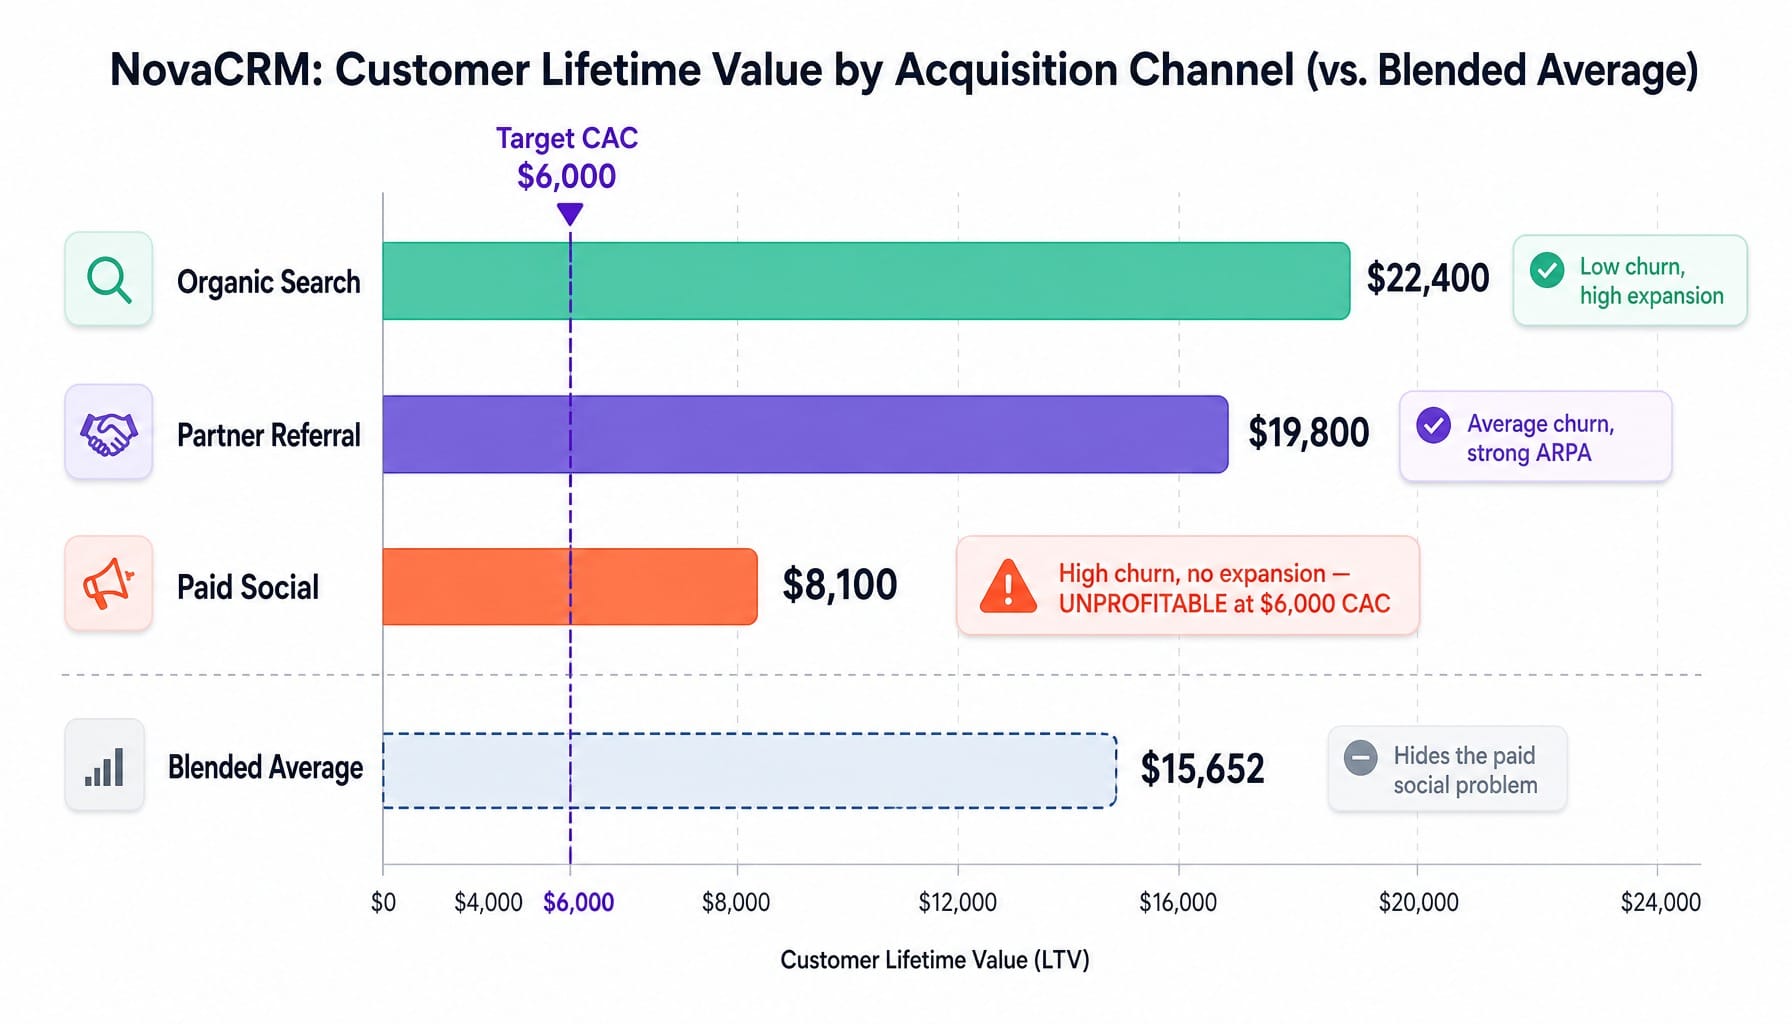
Imagine NovaCRM reports its blended LTV of $15,652 to the board. The number looks healthy. But when segmented by acquisition channel, a completely different picture emerges:
- Organic Search Customers: LTV of $22,400 (lower churn, higher expansion rates)
- Partner Referral Customers: LTV of $19,800 (average churn, strong initial ARPA)
- Paid Social Customers: LTV of $8,100 (high churn, no expansion)
The blended number completely obscures the fact that at a target CAC of $6,000, the paid social channel is unprofitable. The company is lighting money on fire acquiring these customers, but the high performance of the organic channel masks the damage in the blended average.
This is why segmented LTV is the only LTV that matters for decision-making. The most important segmentation dimensions are:
- Acquisition Channel: Which channels bring in your best customers?
- Pricing Tier: Enterprise customers almost always have a higher LTV than SMBs.
- Cohort Vintage: Have customers acquired in Q3 retained better than those from Q1?
- Geography: Do customers in EMEA have different retention patterns than those in North America?
Illustrative LTV benchmarks vary dramatically by segment:
- SMB / Self-Serve: $1,500 – $8,000
- Mid-Market: $15,000 – $60,000
- Enterprise: $80,000 – $300,000+
LTV only becomes a decision-making instrument when it's segmented by the dimensions you can actually act on. A blended dashboard is for reporting; a segmented one is for running the business.
Read more: How to Build SaaS Marketing Attribution That Actually Drives Pipeline (Not Just Dashboards)
What Is a Good LTV for SaaS Companies?
A healthy SaaS LTV:CAC ratio should ideally fall between 3:1 and 5:1. This means for every dollar you spend to acquire a customer, you should expect to get at least three dollars back in gross profit over their lifetime.
However, this ratio is meaningless without its partner metric: the CAC payback period. A 3:1 ratio with a 24-month payback period is a capital-intensive business. A 3:1 ratio with an 8-month payback is a cash-generating machine.
CAC Payback Period = CAC / (ARPA × Gross Margin)
Investors and operators look for a CAC payback period of under 12 months for venture-backed SaaS. This means you recoup your acquisition cost within the first year, and every subsequent month is pure profit.
Absolute "good" LTV figures are entirely dependent on your target market and CAC. A $2,000 LTV might be fantastic for a self-serve product with a $400 CAC, but it would be disastrous for an enterprise product with a $15,000 CAC.
One final caveat: if you have less than 12 months of data, your LTV calculation is an assumption, not a metric. Your churn rate hasn't stabilized. Instead of obsessing over a hypothetical LTV, focus on leading indicators like 90-day retention rate, feature adoption, and early expansion attach rates.
LTV as a Capital Allocation Framework, Not a Reporting Metric
Most SaaS teams calculate LTV to report it. The teams that grow fastest calculate LTV to decide where to spend next.
Let's return to NovaCRM. Their segmented LTV analysis revealed that organic search customers have 2.7x the lifetime value of paid social customers. The capital allocation implication is clear: shift the $15,000/month budget from paid social campaigns to content and SEO. The expected LTV of the next 100 customers acquired will increase substantially.
But making this decision requires three things most lean marketing teams lack:
- Segmented LTV data updated monthly, not just for the quarterly board meeting.
- Channel-level CAC tracking that aligns perfectly with the LTV segments.
- The ability to execute the reallocation. This isn't just moving a budget number in a spreadsheet. It means changing landing pages, adjusting content strategy, and optimizing conversion paths for the higher-value segment—simultaneously.
LTV becomes a capital allocation framework when it's connected to the levers that change it: churn reduction (onboarding optimization, proactive outreach), ARPA growth (pricing tier restructuring, usage-based expansion), and acquisition channel optimization. Each lever has a different cost and time-to-impact. LTV analysis tells you which lever to pull. The problem is, most teams don't have the bandwidth to pull it.
Read more: How to Prioritize Marketing Channels With a Limited Budget And Resources (Framework for Lean Teams)
When LTV Tells You What to Fix but Your Team Can't Ship Fast Enough
The tension is now clear: LTV analysis reveals where to invest and what to optimize, but acting on those insights requires simultaneous changes across landing pages, content, SEO, and conversion paths. Most lean teams can't execute across all those surfaces fast enough for the insights to stay relevant. By the time you've redesigned the landing page for your highest-LTV segment, the churn data has already shifted.
This is the execution gap that stalls growth. Spike AI is a marketing execution engine designed to close this gap. It continuously identifies the highest-impact optimization across your website, SEO, and conversion paths, then ships it weekly.
LTV is only useful as a decision-making instrument if you can act on what it tells you before the data changes. The teams that treat LTV as a living capital allocation system need an execution layer that matches their analytical speed. That's what Spike AI provides, turning the backlog of LTV-driven optimizations into a weekly cadence of shipped releases that compound.
See how Spike AI turns LTV insights into weekly shipped optimizations
From Arithmetic to Action
SaaS LTV is not a formula. It's a system of segmented, continuously updated calculations that should drive every acquisition, retention, and pricing decision you make. The companies that treat it as a static, board-deck number will always be out-maneuvered by those that treat it as a real-time capital allocation instrument.
The gap between the two isn't analytical capability; it's execution velocity.
The next time you report your LTV, ask yourself whether you're reporting a number or making a decision. If it's just a number, you're leaving compounding growth on the table.
Frequently Asked Questions
How do you calculate LTV for a SaaS company with both monthly and annual plans?
Calculate LTV separately for monthly and annual cohorts, then create a weighted average based on your customer distribution. Annual plan customers typically have much lower churn, so blending them with monthly subscribers understates risk in your monthly cohort and hides the true value of your annual-plan customers.
Can you calculate SaaS LTV accurately with less than 12 months of data?
Not reliably. With under a year of data, your churn rate hasn't stabilized and you haven't observed a full renewal cycle. Instead, focus on leading indicators like 90-day retention rate and early expansion signals. Treat any LTV figure calculated on less than 12 months of data as a hypothesis, not a metric.
How often should a SaaS company recalculate customer lifetime value?
Monthly for operational decisions (channel allocation, ad spend targets) and quarterly for strategic reporting (board decks, investor updates). Your LTV inputs—especially churn and ARPA—shift as your product and customer mix evolve. A quarterly-only cadence means you're making spend decisions on stale data.
What mistakes most commonly inflate SaaS LTV?
Five errors inflate LTV most often: using revenue instead of gross profit, mismatching time periods (e.g., monthly ARPA with annual churn), ignoring contraction MRR from downgrades, averaging churn across segments with different retention profiles, and never updating the calculation as the business matures. Any one of these can overstate your LTV by 30-50%.
How should multi-product SaaS companies calculate LTV across product lines?
Calculate LTV per product line first. Then, for customers who use multiple products, create a composite LTV weighted by the revenue contribution of each product. Multi-product customers typically have higher retention and ARPA, so blending them with single-product customers masks the powerful impact of cross-selling on lifetime value.
How do you use predictive LTV models to optimize SaaS marketing spend?
Predictive LTV models use early behavioral signals (feature adoption, support ticket frequency, login cadence) to estimate an individual customer's future LTV. This lets you set channel-level CAC ceilings based on predicted—not historical—LTV, allowing you to scale spend on high-potential channels long before the cohort data fully matures.