
SaaS Quick Ratio: Formula, Benchmarks, and Why the Headline Number Lies

TLDR
- The SaaS quick ratio is calculated as (New MRR + Expansion MRR) / (Churned MRR + Contraction MRR). A ratio above 4.0 is considered excellent.
- A high quick ratio can be misleading. A 4.0 ratio driven by expensive new-logo acquisition is more fragile than a 3.0 ratio driven by capital-efficient expansion revenue.
- Decompose the ratio's numerator to understand your growth quality. If the new MRR consistently makes up over 70% of your gains, your growth is likely dependent on high CAC spend.
- Segment your quick ratio by customer cohort, plan tier, and acquisition channel. A blended, company-wide ratio hides critical pockets of churn or contraction.
- The 4.0 benchmark is less relevant for usage-based and PLG models, where structural contraction MRR can artificially lower the ratio. Benchmark against similar companies.
The SaaS quick ratio is a growth-efficiency metric that compares recurring revenue gains—from new and expansion MRR—to recurring revenue losses from churn and contraction. A SaaS company reports a quick ratio of 4.2 to its board and celebrates. The number signals healthy, efficient growth. Six months later, net revenue retention has collapsed.
What happened? The headline number looked healthy, but the underlying composition was brittle. 80% of the numerator was new-logo MRR fueled by aggressive ad spend, while expansion from existing customers was flat. The moment the acquisition pipeline slowed, the ratio cratered.
This is the central problem with how most teams use the SaaS quick ratio. They treat it as a final grade when it's really a starting point for diagnosis.
This guide will walk you through the formula and benchmarks, but more importantly, it will show you how to decompose the ratio to see what it's really telling you about the durability of your growth. We'll cover the calculation, worked examples, why the headline number lies, and how to improve the components that matter most.
What Is the SaaS Quick Ratio?
The SaaS quick ratio measures how efficiently a company grows its recurring revenue relative to what it loses from customer churn and downgrades. Unlike most SaaS metrics, it deliberately ignores cost—it tells you nothing about whether growth is profitable, only whether it is durable. If your business is a bucket, the quick ratio measures how much water you're adding for every drop that leaks out.
First popularized by Mamoon Hamid at Social Capital, the metric provides a blunt but powerful assessment of growth quality. A high ratio suggests strong product-market fit and an effective go-to-market motion. A low ratio signals a "leaky bucket problem," where churn and contraction erase new revenue gains.
It's critical not to confuse the SaaS quick ratio with the traditional accounting quick ratio (or "acid-test ratio"), which measures a company's ability to cover its short-term liabilities with liquid assets. The SaaS version is purely focused on the momentum of recurring revenue. It's most useful not as a single number on a dashboard, but as a decomposed trend that reveals the true source of your growth.
How to Calculate the SaaS Quick Ratio
The formula for the SaaS quick ratio is a straightforward comparison of revenue gains to revenue losses over a specific period, typically a month or a quarter.
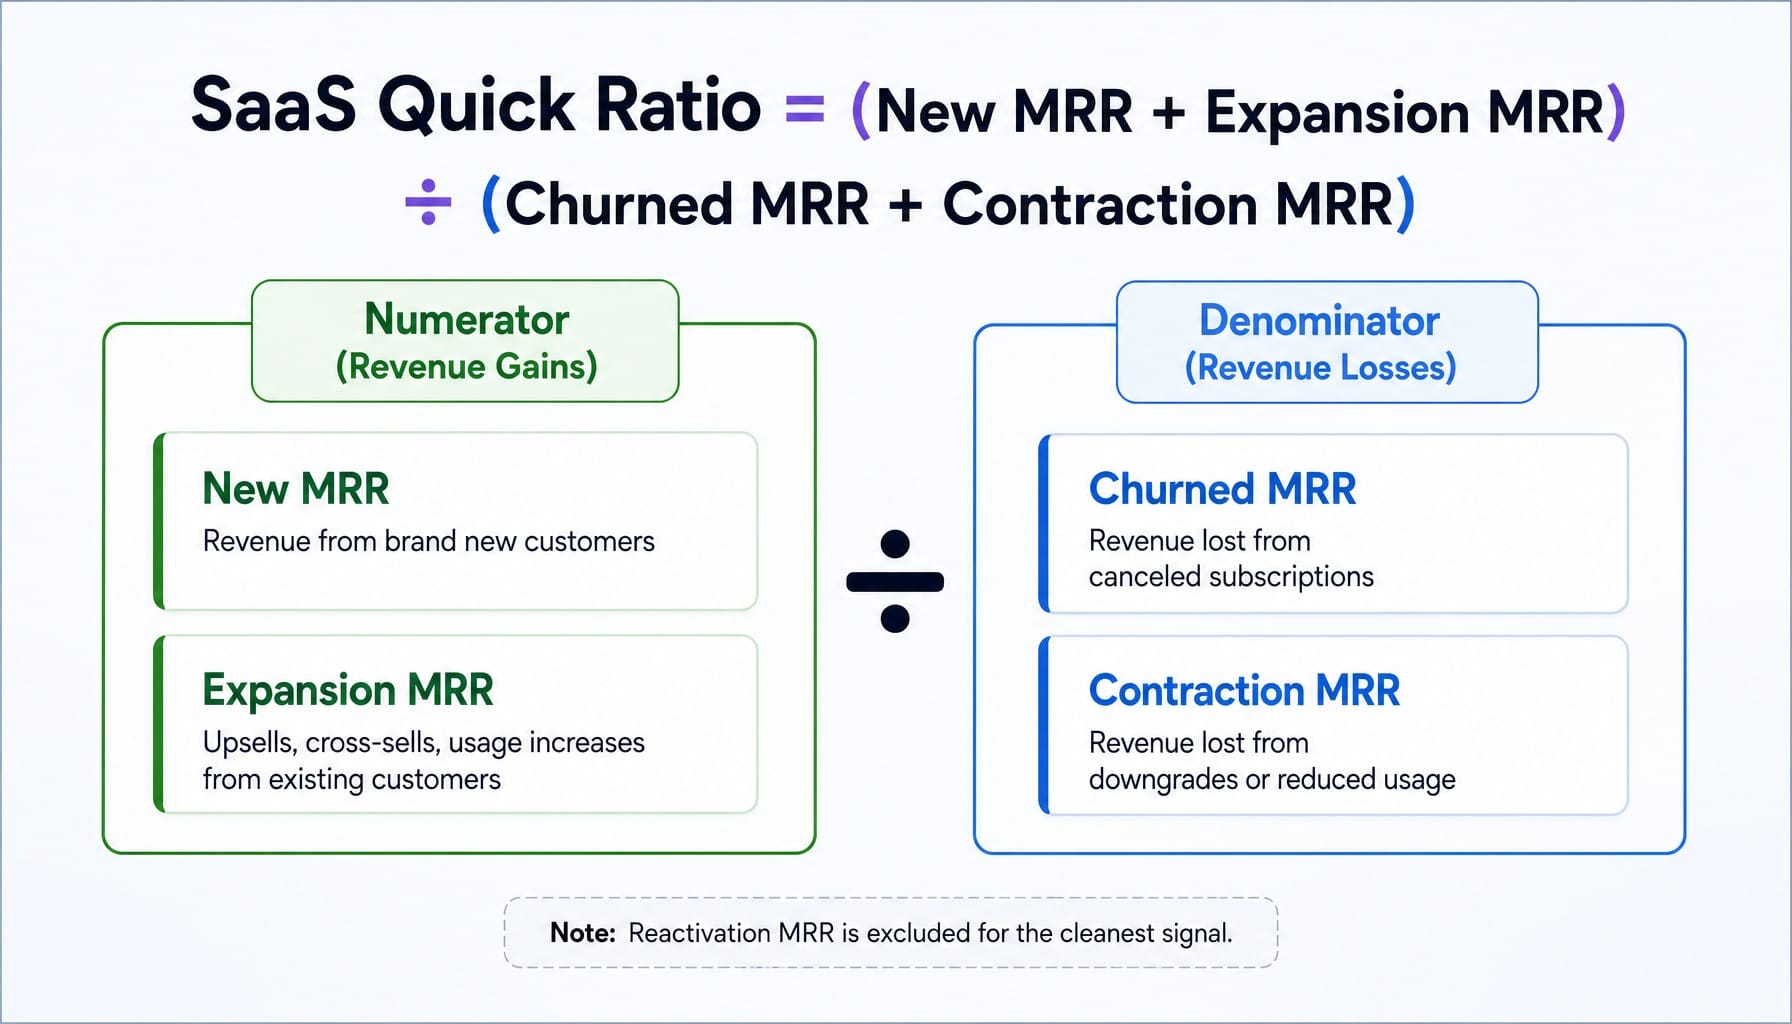
SaaS Quick Ratio Formula = (New MRR + Expansion MRR) ÷ (Churned MRR + Contraction MRR)
To calculate it, you need four components from your MRR waterfall or MRR bridge:
- New MRR: The monthly recurring revenue generated from brand new customers acquired during the period.
- Expansion MRR: The additional recurring revenue from existing customers through upsells, cross-sells, or usage increases. This is a key indicator of your ability to grow your installed base.
- Churned MRR: The total recurring revenue lost from customers who canceled their subscriptions during the period. This represents logo churn.
- Contraction MRR: The recurring revenue lost from existing customers who downgraded to a lower-priced plan, reduced their seat count, or decreased usage.
What about Reactivation MRR—revenue from former customers who restart a subscription? The original framework from Hamid excludes it. Including reactivation MRR can inflate the ratio with revenue that may not be repeatable or predictable. For the cleanest signal, track it separately or report the ratio both with and without it to see its impact.
The formula works identically for Annual Recurring Revenue (ARR); simply substitute the ARR components for their MRR counterparts. The denominator's power is its simplicity, combining all lost MRR into one figure. But this is also a weakness, as it obscures whether you have a customer retention problem (high churn) or a pricing/value problem (high contraction).
SaaS Quick Ratio Example: Walking Through the Math
Looking at the formula is one thing; seeing how it plays out with real numbers reveals why the headline figure isn't enough. Let's walk through two contrasting scenarios for the same hypothetical B2B SaaS company.
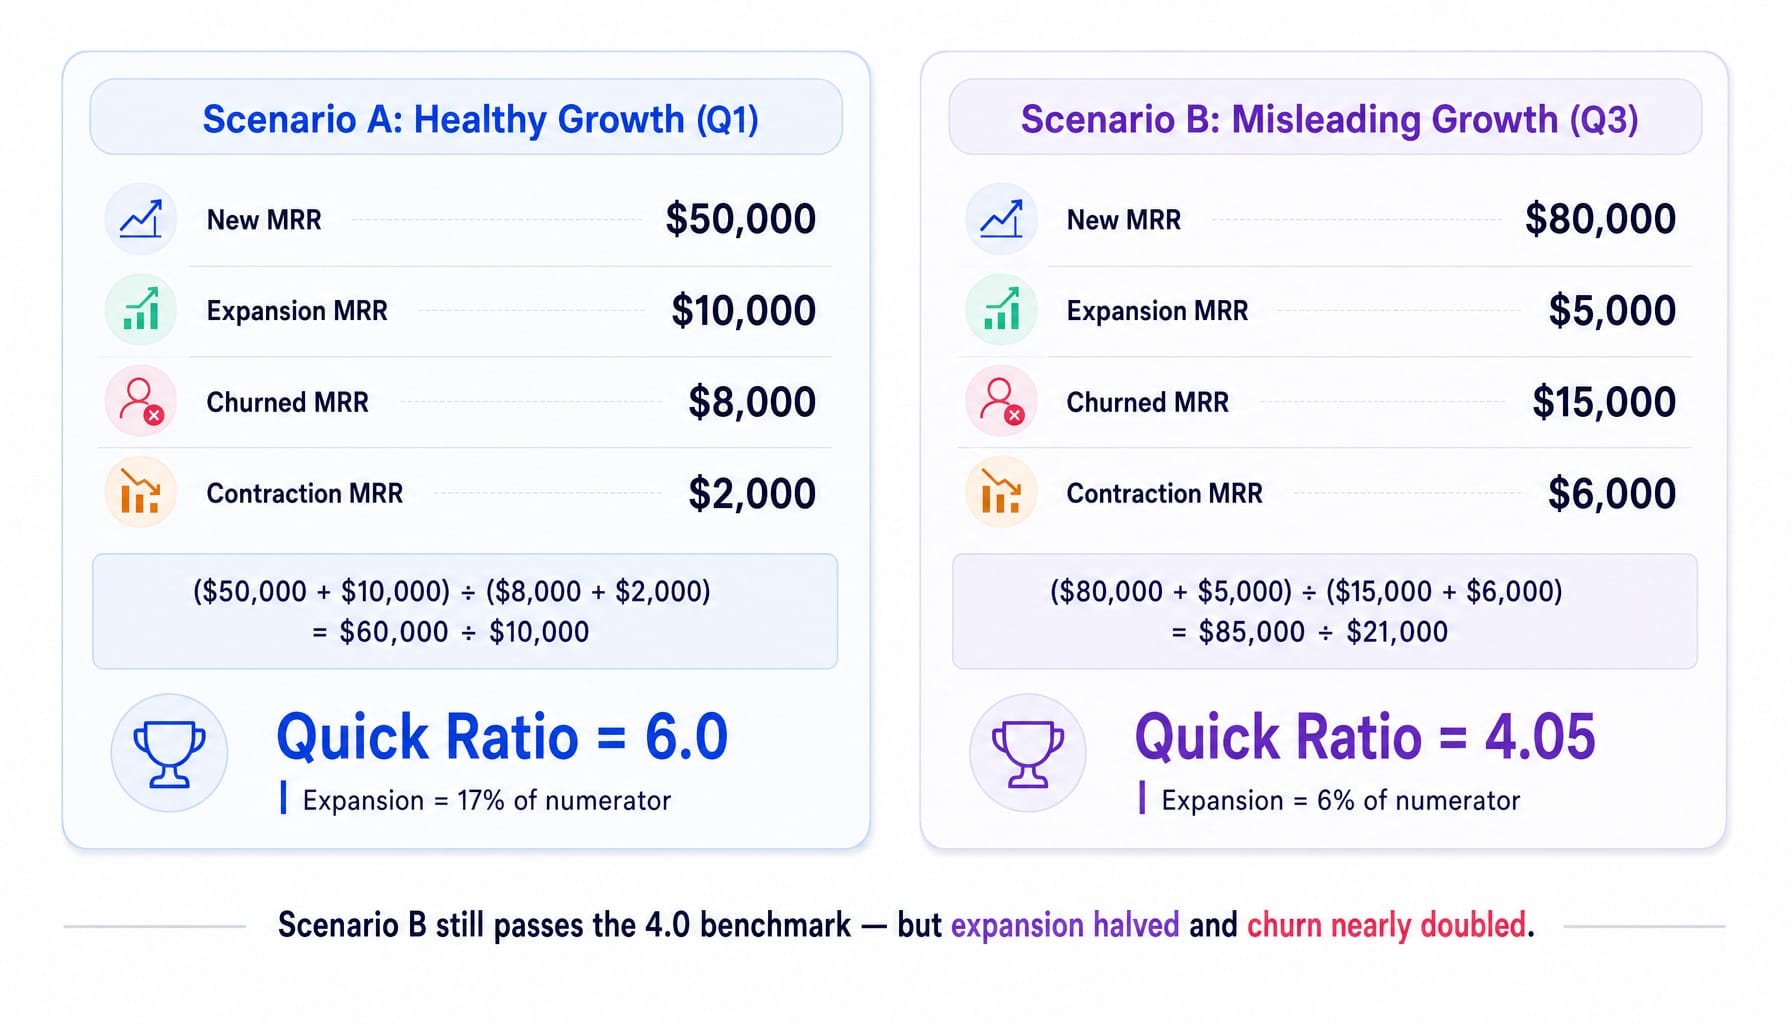
Scenario A: Healthy Growth (Q1)
In Q1, the company's MRR movements are:
- New MRR: $50,000
- Expansion MRR: $10,000
- Churned MRR: $8,000
- Contraction MRR: $2,000
The calculation is:
- Numerator (Gains): $50,000 + $10,000 = $60,000
- Denominator (Losses): $8,000 + $2,000 = $10,000
- Quick Ratio: $60,000 / $10,000 = 6.0
A ratio of 6.0 is excellent. The company is adding $6 of recurring revenue for every $1 it loses.
Scenario B: Misleading Growth (Q3)
Six months later, the company has ramped up its sales team. The numbers now look like this:
- New MRR: $80,000
- Expansion MRR: $5,000
- Churned MRR: $15,000
- Contraction MRR: $6,000
The calculation is:
- Numerator (Gains): $80,000 + $5,000 = $85,000
- Denominator (Losses): $15,000 + $6,000 = $21,000
- Quick Ratio: $85,000 / $21,000 = 4.05
The ratio is still above the 4.0 benchmark, and the board might see this as a continued success. But look closer. Expansion revenue has been cut in half, while churn has nearly doubled. The company is now entirely dependent on expensive new-logo acquisition to keep the ratio afloat. This is the leaky bucket problem in action—you're pouring water in faster, but the holes in the bottom have gotten bigger. The composition of the ratio tells a more dangerous story than the headline number.
SaaS Quick Ratio Benchmarks by Company Stage
A quick ratio above 4.0 has been the industry benchmark since Mamoon Hamid popularized it, but applying it uniformly across all company stages and pricing models is a mistake. The context matters more than the absolute number.
Here's a more nuanced way to interpret your ratio:
- Above 4.0 (Excellent): This signals strong growth efficiency. For every $1 of MRR lost, you're generating over $4 in new and expansion revenue. This is typical of early-stage companies with strong product-market fit and a low absolute churn base. However, beware the denominator illusion: if you only have 30 customers, losing one barely moves the denominator, which can artificially inflate your ratio.
- 1.0 to 4.0 (Average): Growth is happening, but churn and contraction are consuming a significant share of your gains. In this range, the trend is more important than the number itself. Is your ratio climbing from 1.5 to 2.5, or falling from 3.5 to 2.5? The former shows improving efficiency; the latter signals a potential problem.
- Below 1.0 (Warning): The business is shrinking. Your revenue losses are greater than your gains, indicating a severe churn or product-market fit issue that needs immediate attention.
The 4.0 benchmark starts to break for modern SaaS models. For PLG and usage-based companies, structural contraction is a feature, not a bug—customers naturally scale usage up and down. This permanently inflates the denominator, meaning a "healthy" quick ratio might be closer to 2.5 or 3.0. Always benchmark against companies with a similar model, using data from sources like the OpenView SaaS Benchmarks or KeyBanc's SaaS Survey.
Decomposing the Quick Ratio: New-Logo vs. Expansion-Driven Growth
A quick ratio tells you the speed of growth relative to loss. It does not tell you the quality of that growth. Decomposing the numerator into its two components—new-logo MRR vs. expansion MRR—reveals whether your growth is durable or fragile. All MRR growth is not created equal.
New-logo-heavy growth requires constant CAC spend to sustain the ratio. If acquisition slows for even one quarter, the whole model can collapse. In contrast, expansion-heavy growth compounds from the existing customer base and is far more capital-efficient. This distinction directly affects valuation; as the Bessemer Cloud Index shows, companies with high net dollar retention (NDR) consistently trade at higher revenue multiples, even with similar top-line growth rates.
Why New-Logo-Heavy Ratios Are Fragile
When new MRR dominates the numerator, the quick ratio is essentially measuring sales velocity, not growth efficiency. Consider a company spending $200K/month on acquisition to generate $80K in new MRR, with only $5K in expansion. Their quick ratio might look strong, but the moment CAC rises or pipeline slows, the ratio craters because there is no expansion engine to sustain it.
This is the "treadmill problem"—you have to keep spending more on sales and marketing just to stay in place. If your numerator is consistently over 70-80% new MRR, your quick ratio is a lagging indicator of your sales budget, not a leading indicator of your business health. It often correlates with a high burn multiple, signaling inefficient growth.
How Expansion Revenue Changes the Ratio's Meaning
An expansion-dominant numerator signals deep product-market fit and strong pricing power. Your existing customers are voluntarily spending more over time, which is the most capital-efficient growth there is. A company with 60% of its numerator from expansion MRR can sustain its quick ratio even if new-logo acquisition slows, because that growth compounds from the installed base.
This is directly connected to net dollar retention. A company with over 120% NDR is effectively growing its existing cohorts, which means the quick ratio's numerator is self-reinforcing. This is why investors at Series A and beyond increasingly ask for a decomposition of the quick ratio, not just the headline number. Mamoon Hamid's original 4.0 benchmark predates the modern expansion-led growth era; it was set when most SaaS growth was new-logo-driven. Today, a 3.5 ratio with strong expansion is often valued more highly than a 4.5 ratio built on a fragile, new-logo-only foundation.
SaaS Quick Ratio vs. Net Revenue Retention and Related Metrics
The SaaS quick ratio incorporates new customer acquisition alongside existing-customer behavior, while net revenue retention (NRR or NDR) isolates the existing customer base. They answer different questions: the quick ratio asks whether total growth outpaces total loss, while NRR asks whether your installed base is growing or shrinking on its own.
A high NRR can mask a failing go-to-market motion, while a high quick ratio can mask a churn problem. Using them together gives you a more complete picture. Here's how the quick ratio compares to other key SaaS metrics:
The quick ratio is most useful as a monthly health check. NRR is the better indicator of long-term compounding growth. LTV:CAC and burn multiple measure unit economics and capital efficiency, which the quick ratio ignores. Tools like ChartMogul and ProfitWell Metrics by Paddle can calculate and display these metrics side-by-side, giving you a holistic view of your business performance.
When the SaaS Quick Ratio Misleads: Limitations and Failure Modes
The SaaS quick ratio can actively mislead in at least five common scenarios. Most teams encounter at least one of them, which is why you should never report the number without context.
- The denominator illusion at an early stage. With 30 customers and $15K MRR, losing one $500/mo customer barely registers in the denominator. This can inflate the ratio to 8.0 or higher, creating a false sense of security before the business has any proven retention muscle.
- Annual contract transitions. When a company shifts from monthly to annual billing, churned MRR drops to near-zero for 11 months, then spikes in the renewal month. This creates wild ratio volatility that has nothing to do with business health. A trailing 12-month average is essential to smooth this out.
- Seasonal revenue spikes. A large enterprise deal closing in Q4 can inflate new MRR for one month, producing a ratio of 12.0. The next month, it might be 1.5. This noise makes the monthly ratio almost useless for trend analysis without smoothing.
- Reactivation noise. As mentioned earlier, including reactivated customers in the numerator inflates the ratio with revenue from customers who have already proven they are a churn risk. This isn't the same quality of growth as a net-new logo or an upsell.
- Cost blindness. This is the big one. A company spending $3 in CAC for every $1 of new MRR can have a beautiful quick ratio while burning cash at an unsustainable rate. The ratio tells you if you're growing efficiently relative to churn, but it says nothing about whether you're growing profitably.
How to Improve Your SaaS Quick Ratio
Improving your quick ratio is not a single initiative; it depends on which component of the formula is weakest. You must diagnose before you prescribe.
- Reduce Logo Churn. The most capital-efficient way to improve your ratio is to lose less revenue. Focus on the first 90 days of the customer lifecycle—this is where most churn happens. Improve your onboarding flow to accelerate time-to-value. Another low-effort win is tackling involuntary churn from failed payments. Tools like Baremetrics Recover or Chargebee's dunning management can automate this.
- Reduce Contraction MRR. Are customers downgrading because your pricing is misaligned, or because they aren't using the features in their current tier? Run cohort analysis by plan type to see which segments contract most. This often reveals an opportunity to adjust pricing tiers or improve feature adoption.
- Increase Expansion Revenue. This is the engine of durable growth. The three primary expansion mechanisms are usage-based pricing, seat-based upsells, and feature gating higher-value functionality. Track your expansion MRR as a percentage of total MRR monthly. If it's not growing, you have a product packaging or value problem.
- Accelerate New MRR (Efficiently). This is the hardest lever to pull without just spending more money. It requires improving conversion rates across the entire funnel—from website visitor to paid customer—rather than simply increasing your ad budget.
Read more: Pipeline Marketing in 2026: Strategy, Metrics, and Why Most Teams Regress to Lead Gen
The most capital-efficient path is almost always in that order: reduce churn first, then expand existing accounts, and only then focus on accelerating new logo acquisition.
When Improving the Ratio Requires Shipping Faster Than Your Team Can
You've diagnosed the problem. You know you need to reduce logo churn by improving your onboarding flow, or increase new MRR by optimizing your pricing page. But for most lean marketing teams, this is where progress stalls. The gap between knowing what to fix and actually shipping that fix can stretch for weeks or months, eaten up by design reviews, engineering tickets, and competing priorities. Your quick ratio continues to suffer not from a lack of strategy, but a lack of execution bandwidth.
This is the execution gap Spike AI is built to close. Spike AI functions as a marketing execution engine that identifies the highest-impact conversion and retention improvements across your website, then ships them weekly. It turns your backlog of "should-do" fixes into a steady cadence of "dones." Instead of just diagnosing a churn problem, you can deploy a better onboarding page next week. Instead of just identifying a conversion issue, you can ship a new pricing page layout.
How to Track SaaS Quick Ratio: Cadence, Segmentation, and Tools
A single monthly quick ratio is a snapshot. To make it diagnostic, you need a cadence, segmentation, and a system that calculates it automatically. The best practice is to build your analysis from a monthly MRR bridge or MRR waterfall, which breaks down all revenue movement into its core components. This is the raw data from which the quick ratio is derived, and reviewing it weekly surfaces problems before they compound.
Measurement Cadence: Monthly, Trailing, or Both
Calculate your quick ratio monthly for real-time operational visibility. However, monthly ratios are noisy. A single large deal or a seasonal renewal cohort can swing the number dramatically.
For trend analysis and board reporting, use a trailing 3-month or trailing 12-month average. This smooths out the monthly volatility and reveals the actual trajectory of your growth efficiency. When presenting to investors, a trailing 6-month or 12-month view is standard. The key is to calculate monthly but report on a trailing basis.
Segment by Cohort, Plan Tier, and Channel
A blended, company-wide quick ratio hides the most actionable insights. To find the real story, calculate separate ratios for different segments:
- By Customer Cohort: Compare the ratio for customers who signed up in Q1 vs. Q3. This can help you visualize cohort decay curves and see if product changes are improving retention over time.
- By Plan Tier: Is your enterprise tier healthy with a 5.0 ratio while your SMB tier is churning with a 0.8 ratio? A blended average of 2.9 would hide this critical divergence.
- By Acquisition Channel: Do customers from paid search have higher contraction MRR than those from organic search? This helps you optimize channel spend for customer quality, not just volume.
Tools like ChartMogul and Baremetrics support this kind of segmented MRR reporting natively. For teams using subscription management platforms like Stripe Billing or Recurly, the data exists but often requires a dedicated financial planning tool like Maxio, Drivetrain, or Pigment to model it effectively. If you're only tracking one blended ratio, you're missing the signal.
Your Ratio Is a Question, Not an Answer
The SaaS quick ratio is a powerful diagnostic, but only when you treat it as such. A headline number without decomposition by revenue source, cohort, and contract type is a vanity metric that can mask fragile, inefficient growth. It tells you that you're growing, but not how or why.
The single most important operational shift is to stop asking "what is our quick ratio?" and start asking "what is driving each component of our quick ratio, and which component is the highest-leverage target for improvement this month?"
As SaaS pricing models continue to diversify into usage-based, hybrid, and PLG structures, the classic 4.0 benchmark will become even less meaningful. The companies that win won't be the ones chasing a single number. They will be the ones that build the operational cadence to decompose, diagnose, and act on the components of their growth engine every single week.
Frequently Asked Questions (FAQ)
Should reactivation MRR be included in the SaaS quick ratio numerator?
The original Mamoon Hamid framework excludes it. Including reactivation MRR inflates the numerator with less predictable revenue—a customer who churned and returned is not the same quality signal as a net-new logo or an expansion. For the cleanest metric, track reactivation separately and report the ratio both ways.
How does shifting from monthly to annual contracts affect the SaaS quick ratio?
Annual contracts concentrate churn into renewal months, causing artificial ratio spikes in non-renewal months and potential dips during renewal periods. This volatility makes the monthly number unreliable. Use a trailing 12-month calculation to smooth this effect and get a clearer picture of the underlying trend.
Does the SaaS quick ratio matter for bootstrapped companies, or only VC-backed ones?
It matters for both, but for different reasons. VC-backed companies use it to signal growth efficiency to investors. Bootstrapped companies should use it as an internal diagnostic to ensure that hard-won revenue isn't leaking out through churn. For bootstrapped teams, the ratio's cost blindness is less of a risk since they are already capital-conscious.
What SaaS quick ratio do Series A investors typically expect in 2026?
Most Series A investors still look for a trailing quick ratio above 4.0, but they increasingly care more about its composition. A ratio of 3.5 with strong expansion revenue is often more attractive than a 5.0 driven entirely by expensive new-logo acquisition. Be prepared to show the numerator's split between new and expansion MRR.
How does usage-based pricing distort the SaaS quick ratio?
Usage-based models have structural contraction MRR when customers scale down in slow periods; this is normal behavior, not a retention failure. This permanently elevates the denominator, making the ratio appear worse than it is. Consider excluding predictable usage fluctuations from contraction or benchmark against other usage-based companies.
How do you present SaaS quick ratio to a board of directors?
Present the trailing 6-month or 12-month ratio alongside its decomposition. Show the numerator split (new vs. expansion MRR) and the denominator split (logo churn vs. contraction). A trend line showing the ratio over the last 4-6 quarters is crucial. Boards care more about the trajectory and composition than the absolute number in a single month.