What Is a Martech Stack? The Execution-First Guide to Building One in 2026

TL;DR
- A martech stack is an architecture, not a shopping list. Its value is determined by how well tools connect to enable execution, not how many features they have.
- Most stacks fail by creating "tool debt"—the accumulated cost of managing tools that produce dashboards but don't help you ship changes.
- Use the Execution-First Stack Score to evaluate every tool on three dimensions: Actionability, Time-to-Value, and Integration Simplicity. Any tool scoring below 9/15 is a candidate for replacement.
- Rebuild your stack by starting with your biggest shipping bottleneck, not a feature wishlist. Choose one tool per functional layer and require it to score 9/15 or higher.
- AI-native tools are collapsing traditional stack layers by combining identification, prioritization, and deployment, fundamentally changing stack architecture.
Your marketing team probably has a dozen or more tools. A CRM, a CDP, an email platform, an SEO suite, analytics dashboards, a CMS, a project management tool, a heatmap tool, an A/B testing platform, and a few others you half-remember signing up for. Each was added to solve a real problem. Together, they've created a new one.
The team spends more time switching between dashboards, reconciling data, and managing integrations than actually shipping marketing work. I once audited a 14-tool stack for a product-led growth team and found that only three tools produced outputs that directly triggered the next step in a workflow without a human copying data between screens. The other eleven created manual work.
This isn't an isolated problem. It's an epidemic of inefficiency. It's why martech utilization has dropped from 58% to just 33%. Teams are paying for more tools and using less of each.
This guide defines what a martech stack is, maps its core components, and explains why most fail. More importantly, it provides an original scoring framework “The Execution-First Stack Score” that you can use today to evaluate whether each tool in your stack is helping you ship or just generating more dashboards.
What Is a Martech Stack? A Working Definition
A martech stack is the integrated collection of software tools a marketing team uses to plan, execute, measure, and optimize its marketing activities across channels. But that's the textbook answer. The operational reality is that a martech stack is an architecture, and the quality of the connections between tools determines whether it accelerates or obstructs execution.
Most people think of their stack as a list of subscriptions. This is a mistake. A stack is a system with dependencies. Data must flow from your analytics layer to your CRM, from your CRM to your marketing automation platform, and from your website to your customer data platform (CDP). When these connections are weak or require manual intervention, the stack creates friction.
The components vary by business model. A B2B SaaS company's stack (CRM, CDP, SEO, CMS) looks different from a B2C e-commerce brand's (e-commerce platform, ESP, loyalty), but the architectural principle is the same. With over 14,000 martech solutions available as of 2024, stack design matters far more than individual tool selection. A stack is defined not by which tools you have, but by how they connect to help you ship work faster.
The Core Components of a Modern Martech Stack
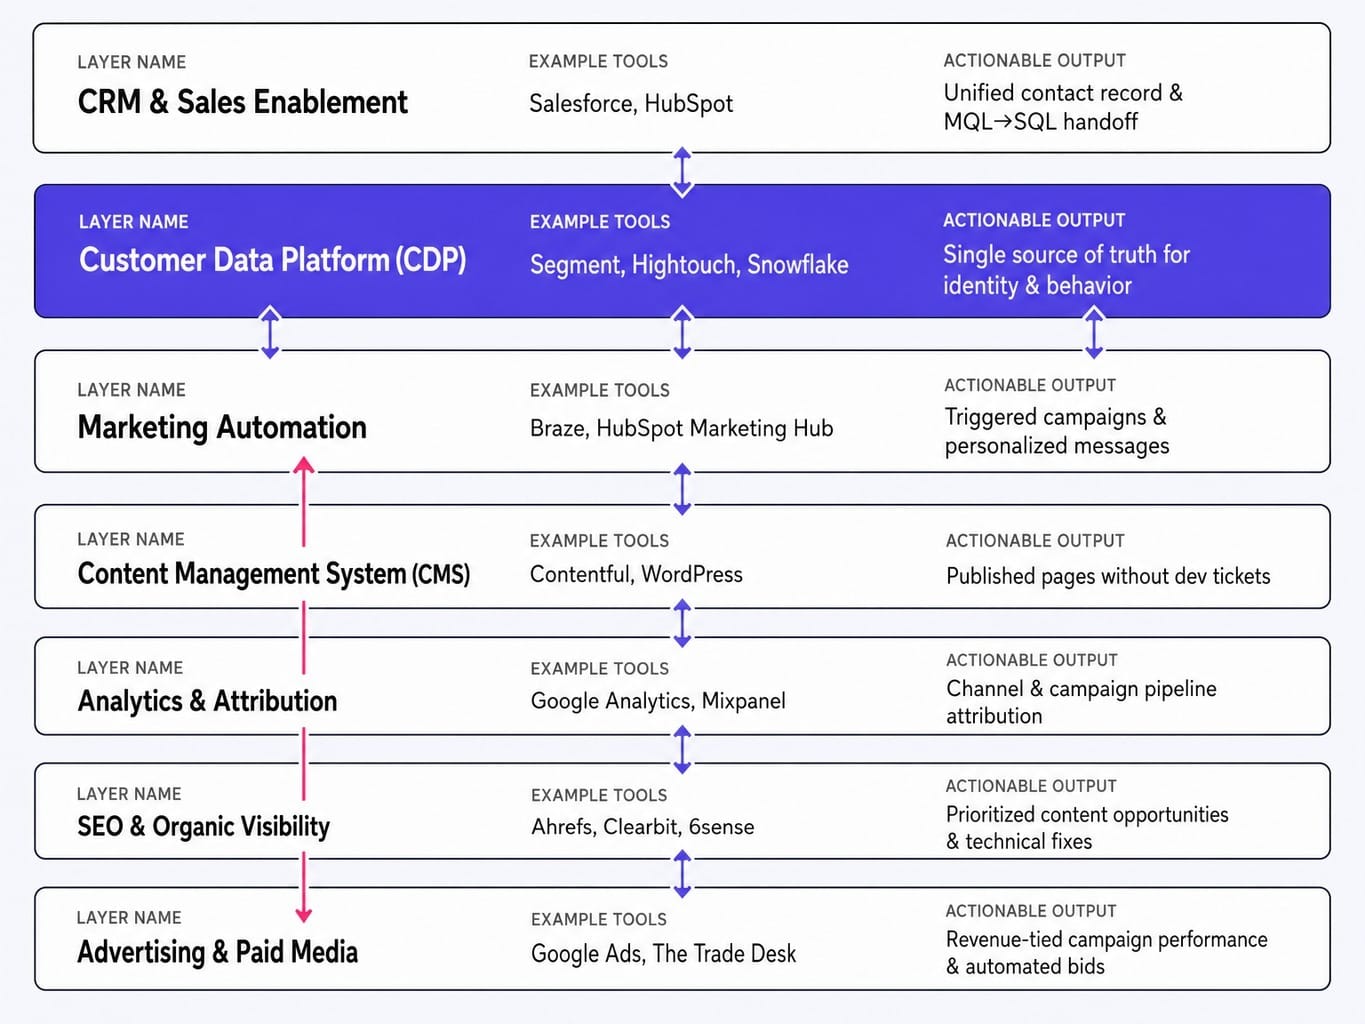
Every martech stack, regardless of company size or industry, maps to seven functional layers. The test of a healthy stack is not whether you have all seven covered, but whether each layer produces an output your team can act on.
CRM and Sales Enablement
This is the system of record for all customer and lead information. It manages the pipeline and the handoff between marketing and sales.
- Examples: Salesforce, HubSpot
- Actionable Output: A unified contact record and clear MQL-to-SQL handoff logic that automates sales notifications.
Customer Data Platform (CDP) / Data Management
This layer unifies customer data from multiple sources to create a single, persistent view of each user. It's the data backbone of your stack.
- Examples: Segment, Hightouch, Snowflake
- Actionable Output: A single source of truth (SSoT) for customer identity and behavior that can be activated in other tools without manual CSV uploads.
Marketing Automation
This is the engine for executing campaigns at scale, from email sequences to multi-channel journeys.
- Examples: Braze, HubSpot Marketing Hub
- Actionable Output: Triggered campaigns and personalized messages that run based on user behavior without requiring a marketer to press "send."
Content Management System (CMS)
The platform for creating, managing, and publishing content to your website.
- Examples: Contentful, WordPress
- Actionable Output: Published landing pages, blog posts, and website updates that don't require a developer or an engineering ticket.
Analytics and Attribution
This layer measures performance, tracks user behavior, and attributes revenue to specific marketing activities.
- Examples: Google Analytics, Mixpanel, Factors
- Actionable Output: A clear signal on which channels and campaigns are driving qualified pipeline, not just vanity metrics like traffic or impressions.
SEO and Organic Visibility
These are the tools for understanding and improving your visibility in search engines, including both traditional SEO and Answer Engine Optimization (AEO).
- Examples: Ahrefs, SEMRush, SurferSEO
- Actionable Output: A prioritized list of content opportunities and technical fixes ranked by their potential impact on traffic and revenue.
Advertising and Paid Media
This layer manages paid campaigns across search, social, and display networks.
- Examples: Google Ads, The Trade Desk
- Actionable Output: Campaign performance data tied directly to downstream revenue, enabling automated bid adjustments based on pipeline impact.
Why Most Martech Stacks Fail: The Tool Debt Problem
Martech stacks don't fail because teams pick the wrong tools. They fail because teams evaluate tools by features and price instead of by execution output. Over time, this creates “Tool Debt”, the accumulated cost of maintaining, integrating, and context-switching between tools that generate reports but not actions.
Consider this common scenario. A growth marketer at a Series B SaaS company runs an SEO audit in Ahrefs. The tool generates a 200-item list of "critical issues." The marketer exports the list to a spreadsheet, manually prioritizes it based on gut feel, creates tickets in Asana, briefs a developer in Slack, and then waits two weeks for a fix to ship. Five tools touched the problem. None of them shipped the fix.
When an experimentation cycle takes two weeks instead of two days because every test requires manual data pulls and cross-tool QA, the compounding cost is staggering. This is the throughput gap that platforms like Spike AI are designed to collapse by removing the human-dependent steps between hypothesis and live test. This isn't a training problem; it's a design problem. The stack produces dashboards, not deployments.
You can spot tool debt by these three symptoms:
- Data Reconciliation > Action: The team spends more time in meetings trying to make numbers from two different tools match than acting on the insights from either one.
- The Integration Tax: Every new tool adds a maintenance burden. The initial API connection is easy; it's the ongoing schema maintenance, error handling, and data reconciliation labor that consumes hours every week.
- The Latency Gap: The time between "insight identified" and "change shipped" is measured in weeks, not hours, compressing the number of meaningful experiments the team can run in a quarter.
The Execution-First Stack Score: A Framework to Evaluate Every Tool
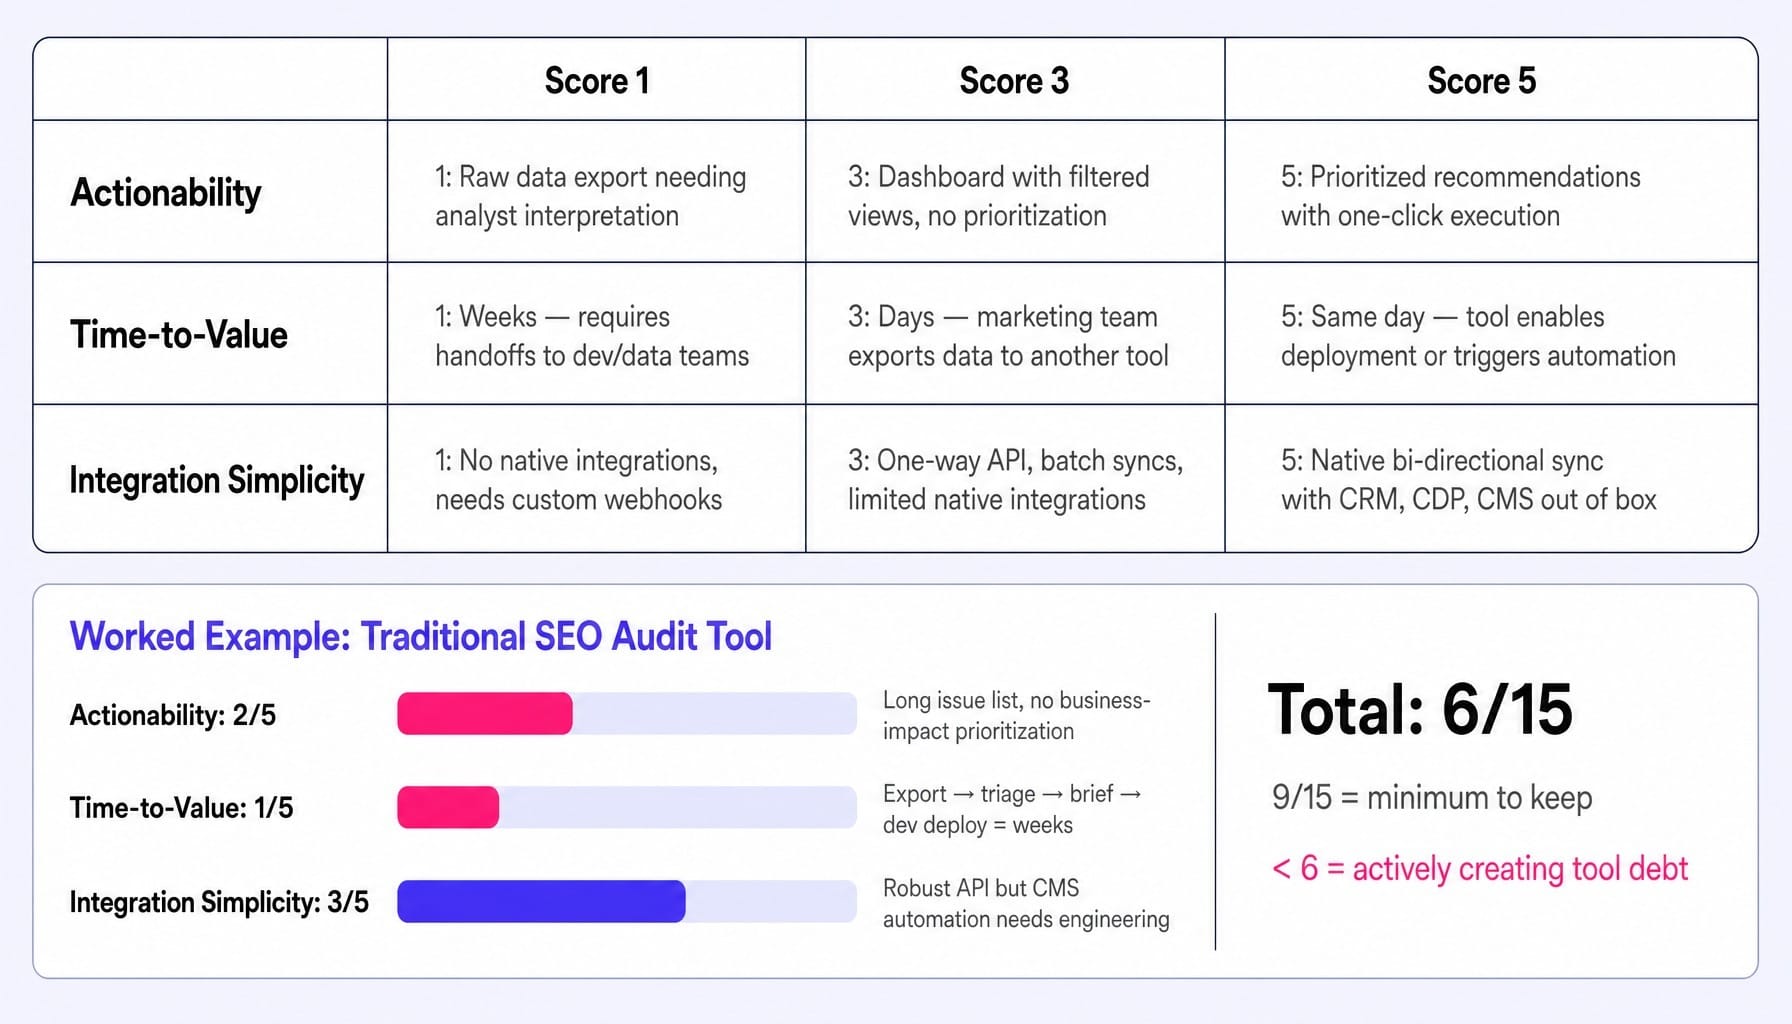
Before adding, keeping, or removing any tool, score it on three dimensions. Each is rated on a scale of 1 to 5. This simple rubric forces you to look past feature lists and measure what matters: does this tool help you ship?
Dimension 1: Actionability
Does this tool produce an output you can act on directly, or does it produce data that requires interpretation and manual next steps?
- Score 1: Raw data export that requires an analyst to interpret and format.
- Score 3: A dashboard with filtered views but no clear prioritization.
- Score 5: Prioritized recommendations with clear next actions or one-click execution.
Dimension 2: Time-to-Value
How long does it take from opening this tool to shipping a change based on its output?
- Score 1: Weeks. Requires handoffs to other teams (e.g., developers, data analysts) or complex manual workflows.
- Score 3: Days. Can be done by the marketing team but requires exporting data and using another tool.
- Score 5: Same day. The tool itself enables the deployment or triggers an automated workflow that does.
Dimension 3: Integration Simplicity
Does this tool connect cleanly to the rest of your stack, or does it create data silos and require custom middleware?
- Score 1: No native integrations. Requires a developer to build custom webhooks or depends entirely on a tool like Zapier.
- Score 3: Has a one-way API or a limited set of native integrations. Data syncs are often batch-based, not real-time.
- Score 5: Native, bi-directional sync with your core systems (CRM, CDP, CMS) that works out of the box.
Worked Example: Scoring a Typical SEO Audit Tool
Let's score a standard tool like Ahrefs or Semrush for a lean marketing team.
- Actionability: 2. It produces a long list of issues but provides little prioritization based on business impact and has no mechanism to implement the fixes.
- Time-to-Value: 1. The findings must be exported, triaged, briefed, and executed by another team (or person), a process that often takes weeks.
- Integration Simplicity: 3. It has a robust API, but connecting it to your CMS to automate anything requires engineering resources.
- Total Score: 6 / 15.
Any tool scoring below 9/15 is a candidate for replacement or consolidation. Any tool scoring below 6 is actively creating tool debt and slowing you down.
How to Run the Score Across Your Full Stack
This exercise reveals the hidden drag in your system. List every tool your team has used in the last 30 days; not every tool you pay for. Score each one on the three dimensions and sort the list by the total score. The bottom quartile represents your biggest sources of tool debt. Look for functional overlaps; if you have two analytics platforms and one scores 11/15 while the other scores 6/15, the decision is clear. This process takes 60-90 minutes and should be repeated quarterly.
For a structured template and guided process, check out our Martech Stack Audit guide.
How to Build (or Rebuild) a Martech Stack with an Execution-First Mindset
Once you've scored your stack and identified the low-performers, the rebuild begins. Most guides offer generic advice like "define your goals." A more effective approach is to focus relentlessly on removing friction.
Start with Your Shipping Bottleneck, Not Your Feature Wishlist
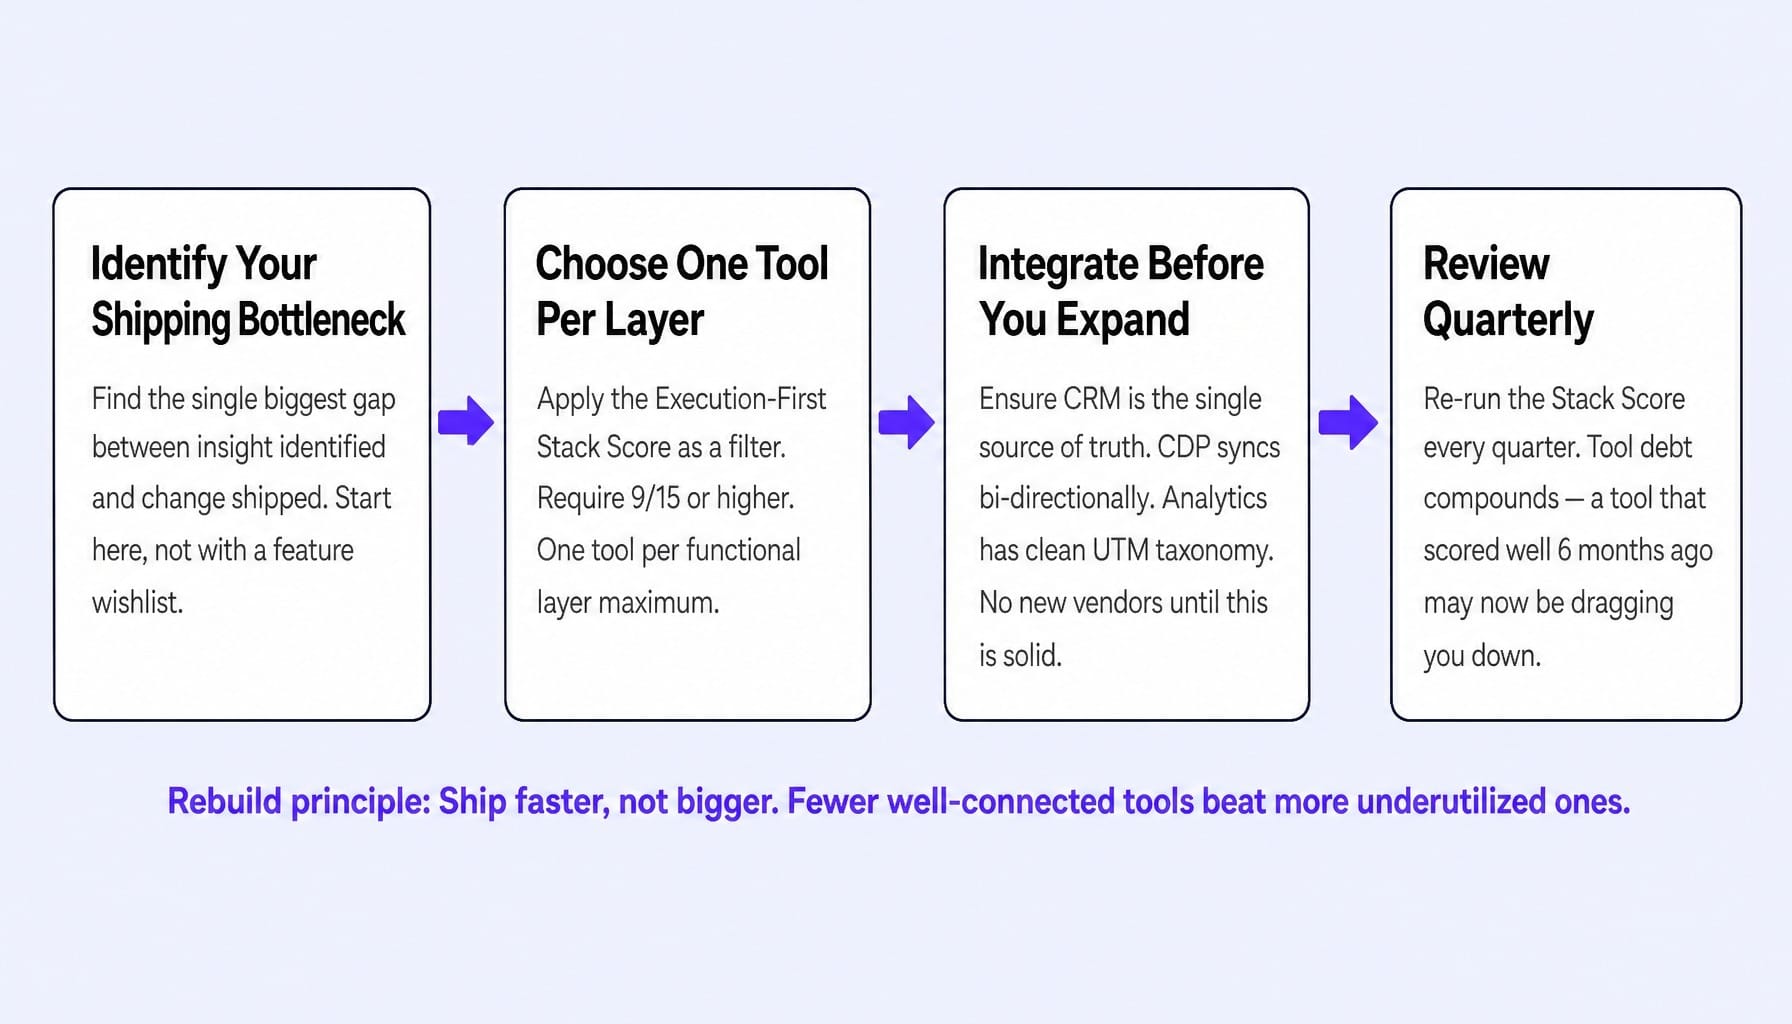
Most stack-building guides start with defining goals, which is too abstract. Instead, start by identifying the single biggest bottleneck between identifying an insight and shipping a change. For a lean team, this is almost always the handoff between the tool that finds a problem and the person (or system) that fixes it. Your first new tool selection should directly address that specific point of friction.
Read more: SaaS Marketing Tools in 2026: How to Build a Stack That Ships, Not Just Reports | Spike AI
Choose One Tool Per Layer and Require It to Score 9/15 or Higher
Resist the temptation to add "best-in-class" point solutions for every micro-function. A lean team cannot maintain more than one tool per functional layer without drowning in integration tax. Apply the Execution-First Stack Score as a non-negotiable filter: if a vendor can't demonstrate a path to scoring 9/15 or higher in your environment, it doesn't earn a place. This naturally favors composable, API-first tools that connect cleanly over feature-rich monoliths that silo data.
Integrate Before You Expand
The most common stack-building mistake is adding a new tool before the existing ones are properly connected. Before you take another vendor demo, ensure your CRM is the absolute single source of truth for contact records, your CDP is syncing behavioral data bi-directionally, and your analytics layer has clean UTM taxonomy governance. Without this foundation, every new tool just adds to the chaos. Most stack diagrams are drawn after the fact to justify purchases, not before to design execution flow.
Review Quarterly: Stack Debt Compounds Like Technical Debt
Stack rationalization is not a one-time project; it's a recurring discipline. Re-run the Execution-First Stack Score every quarter. A tool that scored well six months ago may have degraded as your needs changed or its roadmap diverged from your use case. With the average CMO tenure at just 4.3 years, every leadership change risks introducing new tool preferences. Without a scoring discipline, the stack bloats again.
What AI-Native Tools Mean for Martech Stack Architecture in 2026
The Execution-First framework reveals an important pattern: tools that score highest often don't fit neatly into one of the seven traditional layers. They are increasingly AI-native systems that collapse multiple functions—identification, prioritization, and deployment—into a single workflow.
This isn't a minor efficiency gain; it's an architectural shift.
Traditional stacks are built on the assumption that different tools handle different jobs and humans coordinate between them. AI-native tools challenge this by handling the coordination themselves. For example, instead of an SEO tool that identifies an issue, a project management tool that triages it, and a developer who deploys the fix, an AI-native platform does all three. It identifies the highest-impact CRO opportunity on a landing page, generates the new copy and layout, and deploys it as an A/B test.
Such a system scores 13/15 or higher on the Execution-First framework by default. This doesn't mean AI replaces the entire stack. Your CRM, CDP, and consent management platforms remain essential systems of record. But the action layer of the stack—the part that turns insight into shipped changes—is where these new systems are eliminating the most tool debt.
How Spike AI Closes the Gap Between Your Stack's Insights and Shipped Results
The central tension of this article is that most martech stacks are great at producing data but terrible at producing shipped work. The gap between an insight in a dashboard and a change live on your website is where marketing execution dies.
Spike AI is designed to close that gap. It's not another tool to add to your stack; it's the execution layer that replaces the low-scoring tools in your action layer—the ones that identify problems but leave the "what next?" entirely on your plate.
Every week, Spike AI identifies the single highest-impact move across your website's SEO, CRO, and overall performance, then ships the fix. No engineering tickets. No agency briefs. No backlog paralysis.
In practice, Spike AI consistently scores 13/15 or higher on the Execution-First Stack Score:
- Actionability (5/5): Prioritized by projected revenue impact.
- Time-to-Value (4-5/5): Changes ship within the week.
- Integration Simplicity (4-5/5): Works across your existing systems.
See how Spike AI scores on the Execution-First Stack framework. Book a discovery call.
Your Stack Exists to Help You Ship
The single most important belief shift is this: a martech stack should be evaluated not by how many tools it contains, but by how quickly it converts an identified insight into a shipped change. The moment your stack starts generating more coordination work than execution output, it has become the problem it was meant to solve. The Execution-First Stack Score gives you a repeatable, objective way to diagnose and fix that dysfunction.
Your next step is to apply it. Use our Martech Stack Audit guide to run the self-assessment on your current stack this week and find the tools that are holding you back.
Frequently Asked Questions
How many tools should a martech stack include?
There is no ideal number. The right size depends on your team's capacity to maintain integrations and actually use each tool. A 3-person team that deeply uses 5 well-integrated tools will outperform a team with 15 tools and a 33% utilization rate. Use the Execution-First Stack Score to determine which tools earn their place—the number that remains is your answer.
What is the difference between a martech stack and a marketing automation platform?
A marketing automation platform (like HubSpot or Braze) is one component within a martech stack—it handles triggered campaigns and email sequences. The martech stack is the full collection of tools spanning CRM, CDP, analytics, content, and more. Confusing the two leads teams to over-rely on one platform for functions it was not designed to handle well.
How do you calculate the total cost of ownership for a martech stack?
Add subscription fees, implementation costs, integration maintenance (iPaaS fees, developer hours), training time, and the opportunity cost of context-switching between tools. Most teams undercount the last two. A tool with a $200/month subscription that requires 5 hours of weekly manual work to extract value costs far more than its sticker price suggests.
What is composable martech and how does it differ from an all-in-one suite?
Composable martech means building your stack from API-first, modular tools (like Contentful for CMS or Segment for CDP) that connect through clean integrations. An all-in-one suite (like Salesforce Marketing Cloud) bundles many functions into one vendor. Composable stacks offer flexibility but require integration discipline; suites offer simplicity but risk vendor lock-in and lower scores on individual-layer functionality.
How does a B2B martech stack differ from a B2C martech stack?
B2B stacks prioritize lead scoring, ABM platforms (like 6sense), CRM-to-sales handoff logic, and multi-touch attribution across long buying cycles. B2C stacks prioritize high-volume personalization engines, ESPs for lifecycle marketing, loyalty platforms, and real-time behavioral triggers. The functional layers are the same; the tools and data models within them differ based on buying cycle length and audience scale.