The Best Way to Prioritize CRO Tests (And Why Most Scoring Models Fail)
TLDR
- Most CRO prioritization scores (ICE, PIE) are fabricated confidence. Calibrate your scores against your program's historical win rate and average lift to ground them in reality.
- Ground every prioritization score in two types of local data: quantitative signals (like revenue per visitor and conversion gaps) to find where the problem is, and qualitative signals (from surveys and session recordings) to understand why it exists.
- Before you score anything, cull your backlog. If a test idea isn't supported by at least one data point and a specific, falsifiable hypothesis, archive it. Don't waste time scoring zombie hypotheses.
- When two tests have similar scores, prioritize the one targeting the page or funnel step with higher revenue throughput. The opportunity cost of delaying that test is higher.
- Treat prioritization as a living system. After every test, re-evaluate your backlog based on what you learned. A test that takes 3+ months to reach significance isn't a low-priority test; it's not a runnable test right now.
It's Monday morning. Your growth team is staring at a spreadsheet with 23 A/B test ideas. Someone suggests using an ICE score to bring order to the chaos. Twenty minutes later, every idea has a number, the list is ranked, and the team feels productive.
But the scores are fiction.
An 'Impact' of 8 is a guess. A 'Confidence' of 7 is optimism. An 'Ease' of 6 is whatever the developer said without looking at the code. Two weeks later, the winning test produces no measurable lift.
The problem wasn't the framework; it was the inputs. The frameworks are just containers. If you fill them with guesses, they produce a neatly ranked list of guesses.
The best way to prioritize CRO tests isn't about picking the perfect framework, though that helps. It's about fixing the quality of the data you feed into it, killing hypotheses that don't deserve queue space, and building a system that re-ranks itself as you learn. This is how you build a testing program that compounds, not just spins.
Why Most CRO Prioritization Scores Are Fabricated Confidence
When a team scores 'Impact: 8 out of 10' on a test idea, they are not estimating impact—they are expressing enthusiasm. Frameworks like ICE and PIE ask humans to estimate quantities they have no reliable basis for estimating. If you knew the impact before the test, you wouldn't need to run it.
Consider this common scenario. A SaaS marketing team has two ideas:
- Test a new hero headline: Scores as Impact 9, Confidence 8, Ease 7. It's exciting.
- Reduce form fields on the demo request page: Scores as Impact 5, Confidence 6, Ease 9. It's boring but simple.
They run the headline test. The result is a 0.4% lift that never reaches statistical significance. Then they run the form field test. It produces a 12% lift in demo requests. The scores bore no relationship to the outcomes.
This happens because 'Confidence' is usually anchored to a case study someone just read, not local data. 'Impact' is anchored to how transformative the change feels. This is optimism bias, not analysis.
The fix is empirical calibration. If your program has run 30+ tests, you have a historical win rate and an average lift per winning test. These are your reality checks. Industry-wide, A/B test win rates hover between 20-33%. If your historical winner rate is 25% and your average winning lift is 8%, scoring any single test as a 9/10 impact is statistically delusional.
Here's a rule of thumb: before your next prioritization meeting, review your last 20 test results. Calculate your actual win rate and median lift. Use those numbers as ceiling constraints on future scores. This simple act drains the optimism out of your scores and replaces it with a dose of reality.
What Your Prioritization Scores Should Actually Be Based On
Your prioritization scores are only as good as the evidence behind them. To escape the trap of subjective scoring, you must ground every estimate in two categories of local data: quantitative signals that tell you where the problem is, and qualitative signals that tell you why it exists.
Neither is sufficient on its own. Quantitative data shows you which pages leak the most revenue but not why visitors are leaving. Qualitative data reveals what frustrates users but not how many are affected. Together, they turn your CRO prioritization from guesswork into an evidence-based discipline.
Quantitative Signals: Where the Revenue Leaks
The most important quantitative input for CRO prioritization is not traffic volume alone, but the gap between traffic and conversion value on a given page or funnel step.
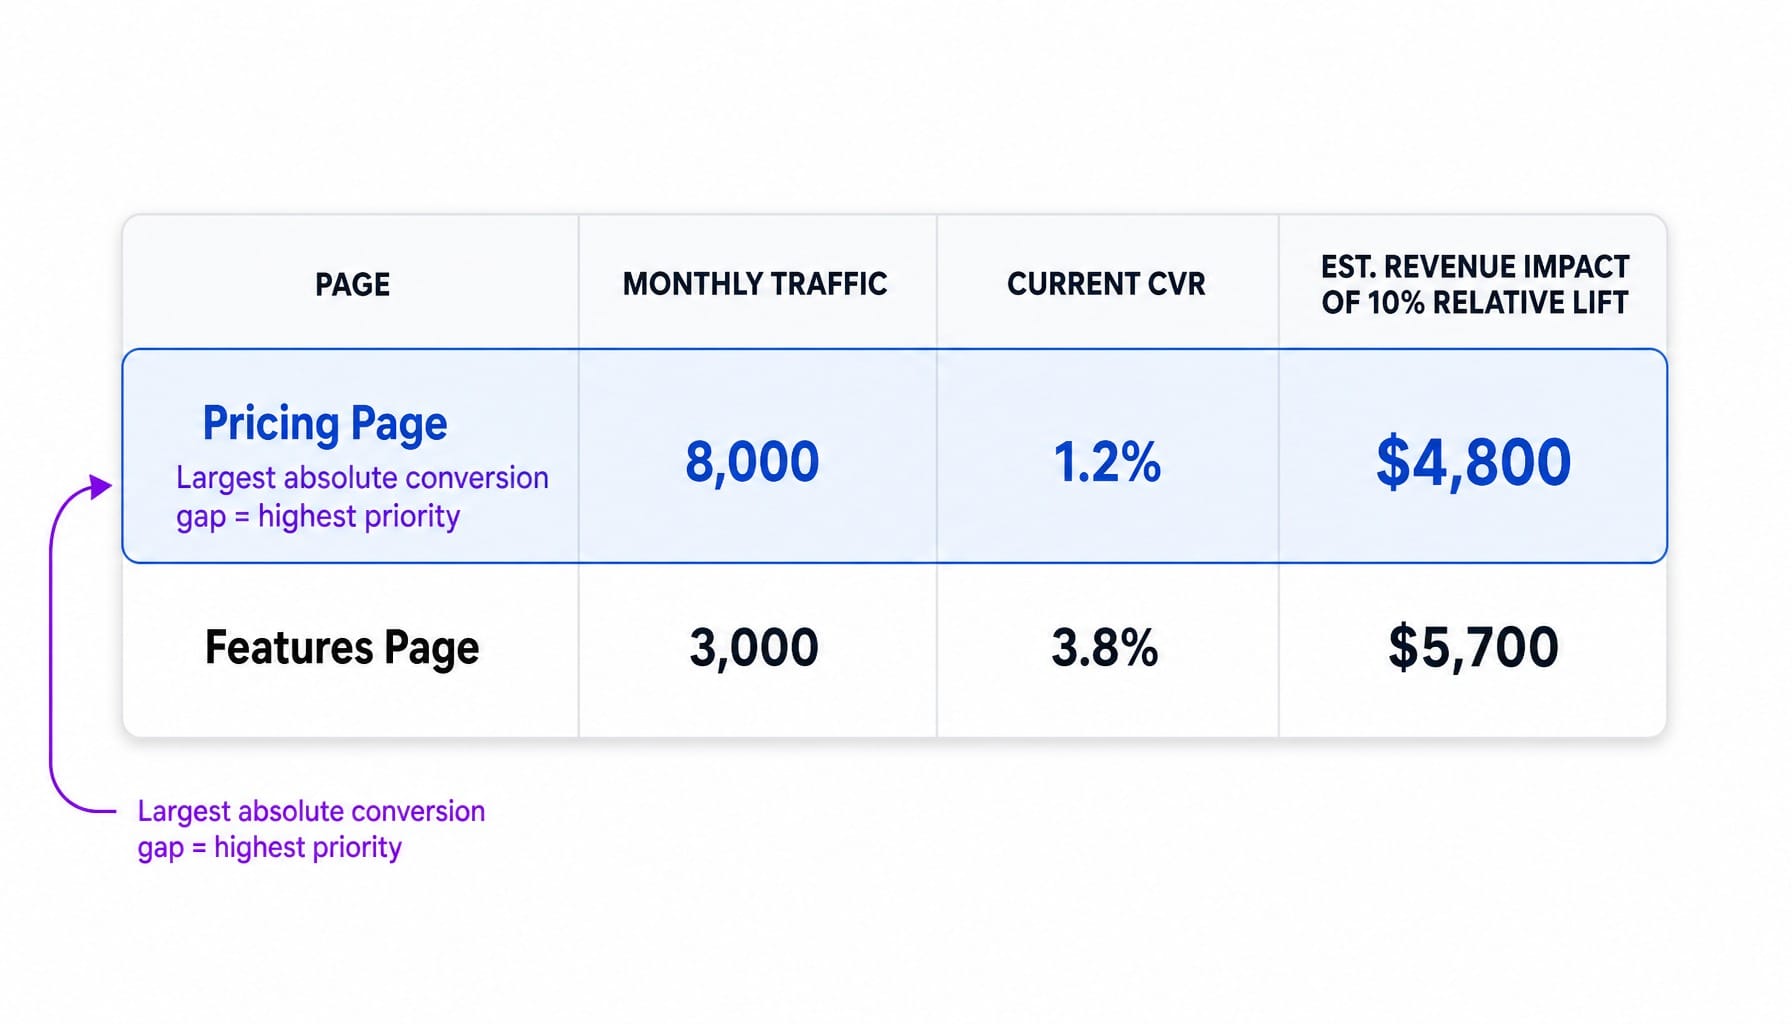
Imagine a pricing page gets 8,000 monthly visits and converts at 1.2% to demo requests, while a features page gets 3,000 visits and converts at 3.8%. The pricing page has a much larger absolute conversion gap. That's where the revenue opportunity lives.
To find these leaks, pull these metrics:
- Page-level conversion rate: The baseline for any lift calculation.
- Exit rate by funnel step: Identifies the exact point of abandonment.
- Revenue per visitor (RPV) by page: Connects page performance directly to money.
- Bounce rate segmented by traffic source: Reveals intent mismatch.
Use tools like GA4's funnel exploration reports or journey analysis in Contentsquare or Hotjar to map these out. Then, build a simple spreadsheet with four columns: Page, Traffic, Current CVR, and Estimated Revenue Impact of a 10% relative lift. This becomes the objective, quantitative input for the 'Impact' score in any framework.
Read more: Hotjar vs Microsoft Clarity (2026): What the Feature Lists Don't Tell You
Qualitative Signals: Why Visitors Don't Convert
Qualitative research is the most underused input in prioritization—and the one that most dramatically improves the reliability of 'Confidence' scores. Without it, confidence is a guess. With it, confidence becomes evidence-backed.
Here's how to get it:
- On-page surveys (Hotjar, Qualaroo): Ask visitors who don't convert, "What almost stopped you from signing up today?" This directly reveals friction points.
- Session recordings (Microsoft Clarity, Contentsquare): Watch for behavioral patterns like rage clicks on unclickable elements, rapid scrolling past key value props, or repeated abandonment at the same form field.
- User testing (5-second tests, task-based usability tests): Uncover comprehension failures. Do users understand your value proposition in the first five seconds? Can they complete a key task?
Let's revisit the pricing page. A team discovers through exit surveys that 40% of visitors say they "couldn't tell which plan was right for them." This single insight transforms a vague 'redesign pricing page' hypothesis into a specific, high-confidence test: 'Add a plan comparison quiz above the pricing table.' The qualitative data provides the why, turning a low-confidence guess into a targeted, evidence-backed experiment.
Three CRO Prioritization Frameworks Worth Using—and When Each One Fits
The framework you choose matters less than the quality of your inputs, but it's not irrelevant. Different frameworks are suited to different team contexts and constraints. The goal here isn't to explain what each one is—it's to help you choose the right one for your situation.
And let's be practical: if your team has fewer than 10 test ideas in the backlog, you don't need a scoring framework. Just rank them by estimated revenue impact and start testing.
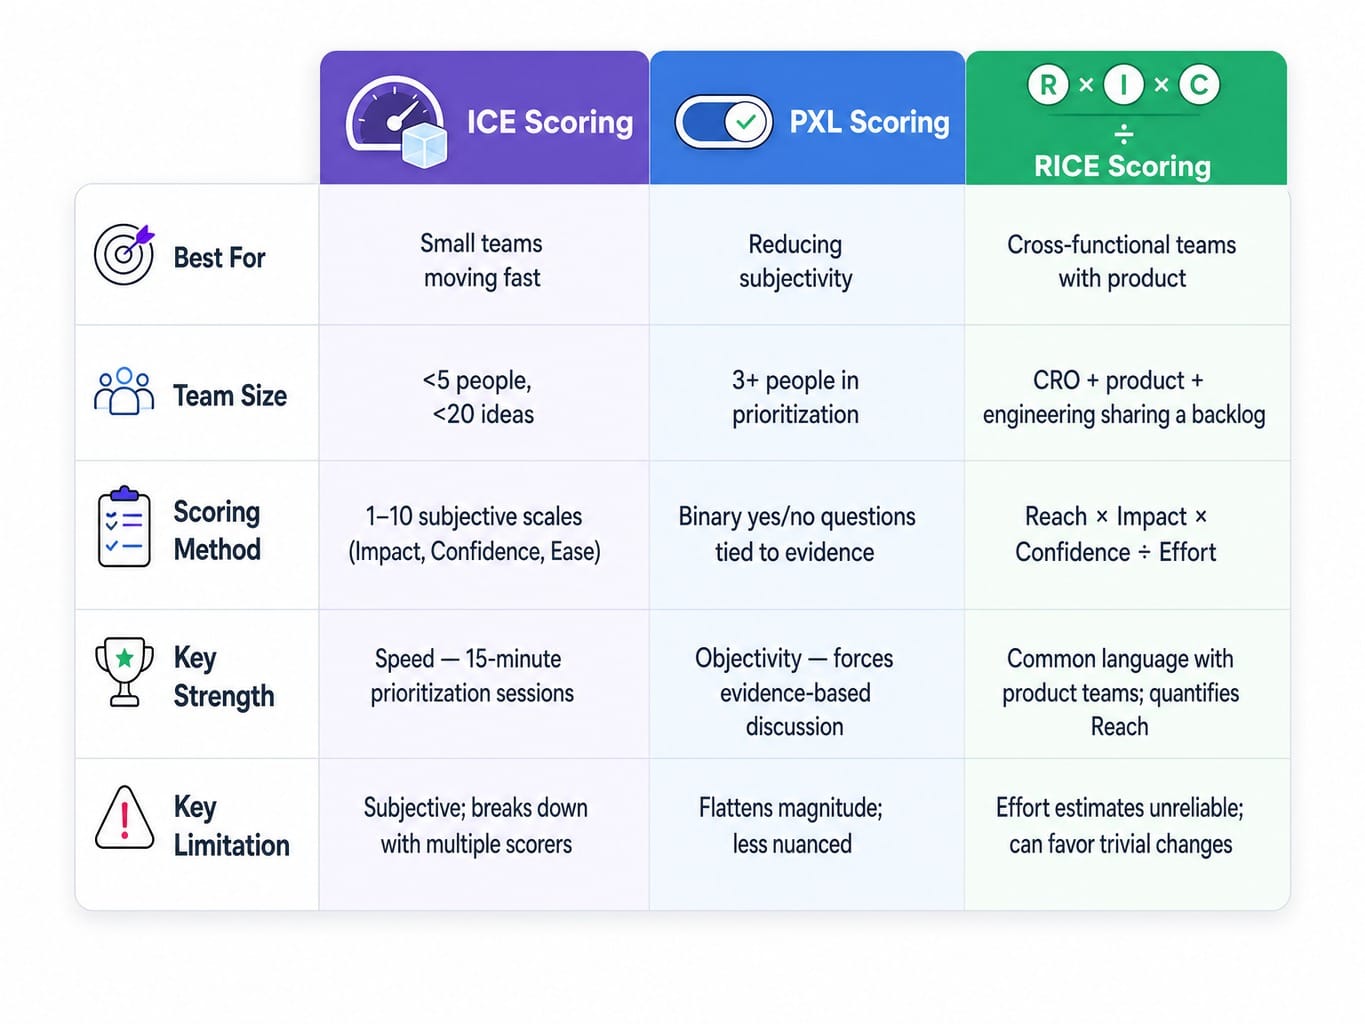
ICE Scoring: Best for Small Teams Moving Fast
ICE (Impact, Confidence, Ease) is the default for a reason: it's simple. It works best for lean teams (fewer than 5 people) with a backlog under 20 ideas, where the speed of decision-making is more critical than absolute precision.
- Use-Case Fit: A 2-person SaaS marketing team running 1-2 tests per month. They need a 15-minute prioritization session, not a half-day workshop.
- Limitation: ICE's strength is its weakness. The subjectivity of Impact and Confidence makes it unreliable unless you apply the empirical calibration from Section 1. It also breaks down when multiple stakeholders score independently, as scores get averaged into meaninglessness without a mechanism to resolve disagreements.
PXL Scoring: Best When You Need to Reduce Subjectivity
Developed by CXL and based on their ResearchXL methodology, the PXL framework addresses ICE's subjectivity problem. It replaces ambiguous 1-10 scales with a series of binary (yes/no) questions tied to available evidence. Is the change above the fold? Is it backed by user testing data? Is it addressing an issue found in analytics?
- Use-Case Fit: Teams with 3+ people involved in prioritization, where alignment and objectivity are more important than raw speed. It forces a more rigorous, evidence-based discussion.
- Limitation: The binary structure can flatten the magnitude of opportunity. A test backed by 500 survey responses and one backed by 3 session recordings both score a '1' for being supported by qualitative data. It's more objective, but sometimes less nuanced.
RICE Scoring: Best for Cross-Functional Teams with Product Involvement
RICE (Reach, Impact, Confidence, Effort) is the strongest framework when CRO tests compete for resources with product features. Why? Because product teams already speak RICE. Its unique advantage is the 'Reach' variable, which forces you to quantify how many users a change actually affects in a given period. This prevents the common mistake of optimizing a low-traffic page while ignoring a high-traffic one.
- Use-Case Fit: B2B SaaS teams where CRO, product, and engineering share a single backlog and need a common language for prioritization.
- Limitation: 'Effort,' typically estimated in person-months, is notoriously unreliable. The division by Effort can also create perverse incentives, where trivial changes on low-traffic pages outscore meaningful changes that require real work.
The Opportunity Cost of Queue Position: Why Order Matters as Much as Score
Most teams treat their prioritized backlog as a static to-do list. They run test #1, then test #2, then test #3. This ignores a critical variable: the opportunity cost of every test that sits in the queue. While a test waits to be run, you are not capturing the potential revenue lift it could be generating.
Consider two tests scored identically at 7.5:
- Test A targets the checkout page, which sees 2,000 monthly transactions at a $150 AOV ($300,000/month in revenue throughput).
- Test B targets a blog-to-demo CTA, which gets 400 clicks per month.
Even with identical scores, the cost of delay is vastly different. Running Test A first means any potential lift applies to a $300K/month revenue stream while Test B waits. Running Test B first means any lift applies to a much smaller surface area while the high-value checkout experiment is deferred. The difference in delayed value could be tens of thousands of dollars per month.
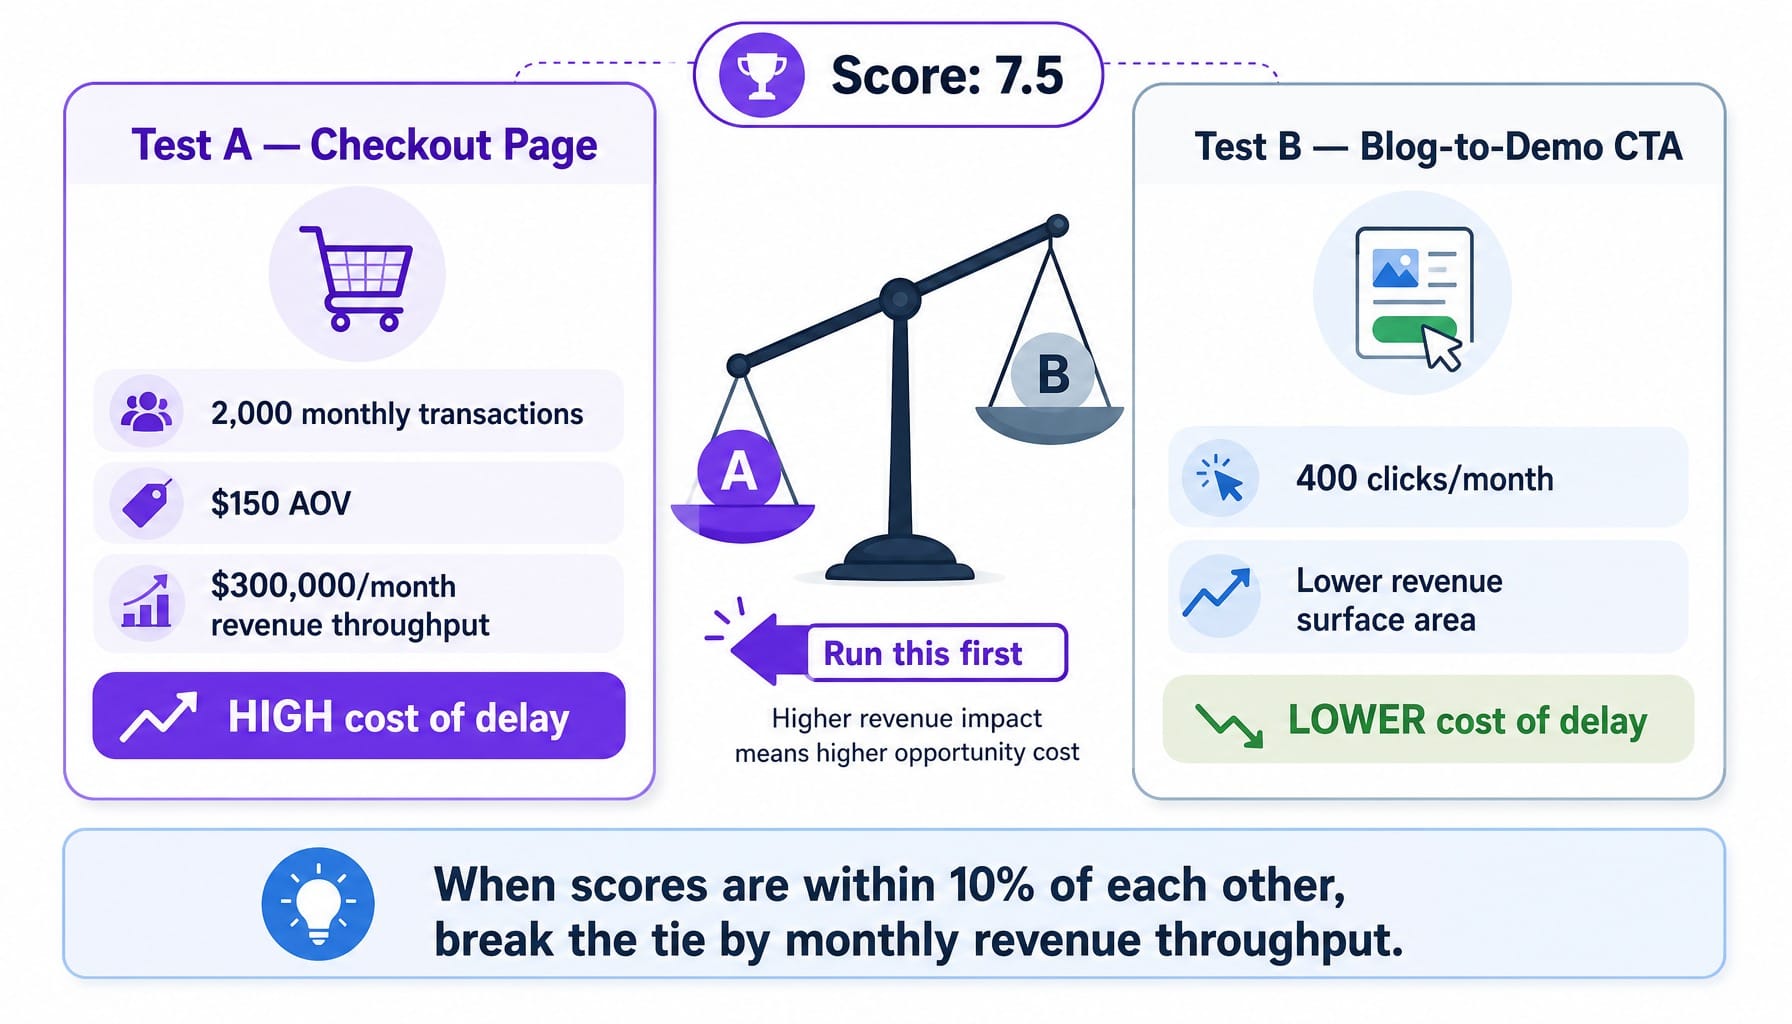
Here's the rule: when two tests score within 10% of each other, break the tie by estimating the monthly revenue flowing through the page or funnel step. The higher the revenue throughput, the more expensive it is to delay. Prioritization isn't just about which test is best—it's about which test is most expensive to postpone.
Kill Your Zombie Hypotheses Before You Score Anything
Before you score a single idea, you need to clean the backlog. Most CRO backlogs are haunted by zombie hypotheses: test ideas added months ago based on a stakeholder's opinion, a competitor's redesign, or a blog post someone read. They persist because no one wants to be the one to delete the VP's idea.
The result is that your prioritization meeting wastes time scoring ideas that have no evidence behind them and no clear connection to a real conversion problem.
Think of the classic zombie: 'Test a chatbot on the homepage.' It was added six months ago after the VP of Sales saw a competitor using one. There's no user research suggesting visitors want to chat, no data showing the homepage is underperforming, and the VP has since moved on. Yet it sits there, consuming scoring time and mental energy every sprint.
Apply this two-question filter before any scoring exercise:
- Is there at least one data point—quantitative or qualitative—suggesting this is a real problem for our users?
- Can you write a specific, falsifiable hypothesis statement (e.g., "By adding X, we will improve Y, as measured by Z")?
If the answer to either is no, archive the idea. Don't delete it; archiving preserves relationships while cleaning the active backlog. The quality of your prioritized list depends as much on what you remove as what you rank.
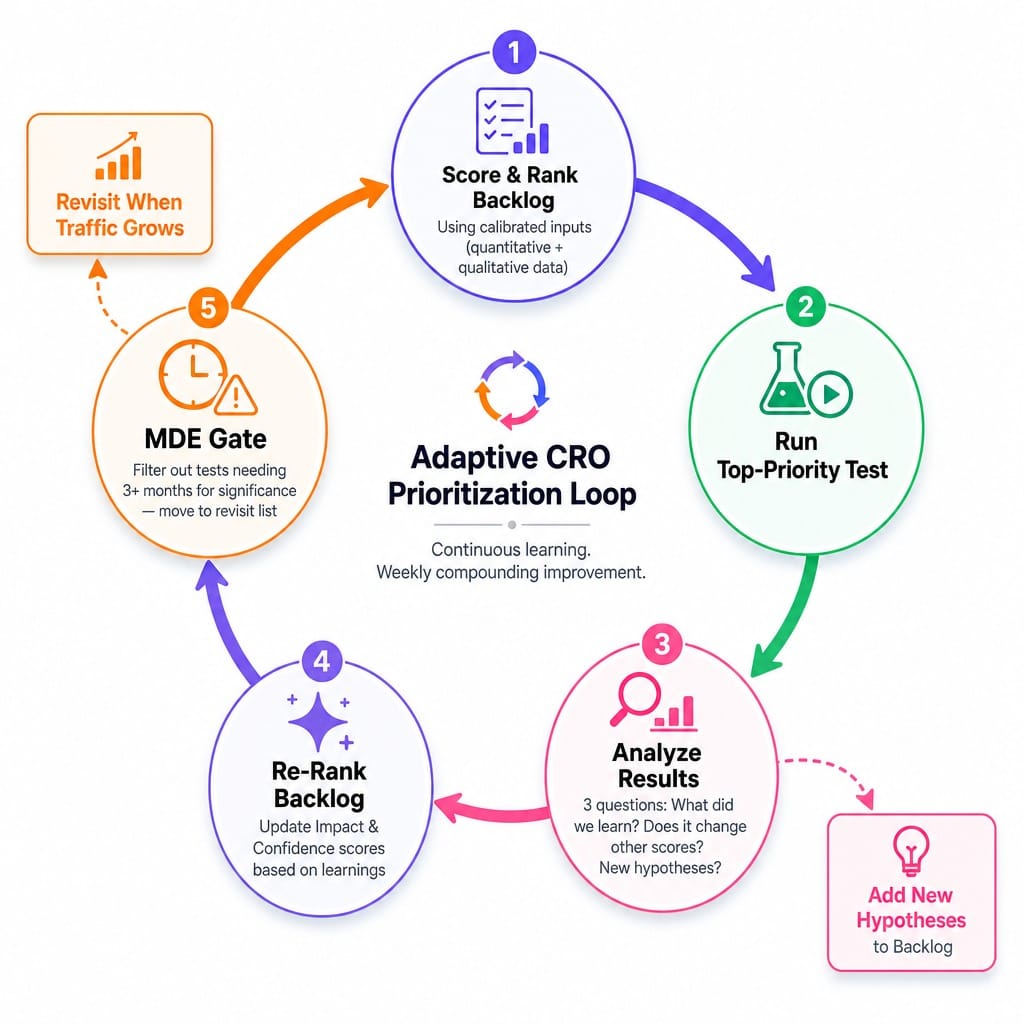
Build a Prioritization System That Re-Ranks as You Learn
A prioritized backlog is not a static document. It's a dynamic system. Every test result changes what you know, which should change what you test next.
A winning test on your pricing page might reveal that plan confusion is a core user problem. Suddenly, three other hypotheses related to plan clarity should jump up the queue, while two tests about homepage messaging become less urgent. This is how learning compounds.
After each test concludes, spend 15 minutes asking three questions:
- What did we learn about user behavior that we didn't know before?
- Does this learning change the expected Impact or Confidence of any other test in the backlog?
- Should any new hypotheses be added based on this result?
Before you re-rank, apply one final filter: Minimum Detectable Effect (MDE). Use a calculator (Evan Miller's is a classic; tools like Statsig or Eppo have them built-in) to check if a test is even runnable. If a page gets 500 visits/month and you need 8,000 visitors per variant to detect a meaningful lift, that test will take 32 months to reach significance. It doesn't matter how high it scores; it's not a test. Move it to a "revisit when traffic grows" list.
This creates an adaptive system. Re-score your active backlog monthly if you run 2+ tests per month, or quarterly if your test velocity is lower. Prioritization is an ongoing process, not a one-time event.
Read more: Stop Syncing Strategy and Execution: Platforms That Unify Marketing Goals With Task Management
What Happens When Prioritization and Execution Run in the Same Loop
The system described in this article—grounded in data, calibrated by history, and dynamically re-ranked—is what an elite CRO agency does for $15-25K a month. Most lean teams simply don't have the bandwidth to maintain this rigor while also designing, building, and launching the tests themselves. The gap between knowing what to test and actually shipping it remains the primary constraint.
This is the gap Spike AI is built to close. It continuously ingests signals across your site, identifies the highest-impact conversion opportunities, and scores them against performance data, not subjective estimates. It then executes the changes and feeds the results directly back into the next prioritization cycle. It's the compound learning loop described above, running every week, not every quarter.
See how Spike AI prioritizes and ships your highest-impact CRO changes weekly
Conclusion
The best way to prioritize CRO tests isn't about finding the perfect framework. It's about building a system. A system where inputs are evidence-based, your backlog is ruthlessly culled of zombies, and your priorities adapt as you learn. Frameworks like ICE, PXL, and RICE are just containers; their output is only as good as what you put in.
Fix your inputs with quantitative and qualitative data. Model the opportunity cost of queue position. And treat your backlog as a living document that gets smarter with every test result. The teams that compound conversion gains are not the ones with the fanciest spreadsheet—they're the ones whose prioritization process is a living, learning system.
Frequently Asked Questions
How do I factor minimum detectable effect into my CRO test priority ranking?
Calculate the MDE for each test's target page using its baseline conversion rate and monthly traffic. If a test requires more traffic than the page will receive in 3 months, it's not runnable regardless of its score. MDE should function as a pass/fail gate before scoring, not as a variable within it.
How do I get stakeholder buy-in for a CRO prioritization framework?
Present the framework as a tool for making decisions transparent and defensible, not as a black box to override ideas. Score stakeholder ideas within the system—even if they rank low—so they see the logic rather than feeling dismissed. The fastest path to buy-in is running one cycle and letting the results validate the process.
What is the best CRO prioritization framework for SaaS versus ecommerce?
The framework matters less than the inputs. That said, RICE often fits SaaS better because 'Reach' forces teams to quantify user impact, which is critical when traffic is concentrated on a few key pages. Ecommerce teams with higher traffic and more pages often benefit from ICE's speed or PXL's objectivity for managing larger backlogs.
How do I prioritize CRO tests across multiple funnels simultaneously?
Score tests within each funnel independently. Then, compare the top-ranked test from each funnel using estimated revenue impact as the tiebreaker. The funnel with the highest revenue throughput and largest conversion gap should get priority. Avoid running multiple tests on the same funnel at once unless you've confirmed no interaction effects.
Can AI or machine learning help prioritize CRO experiments?
Yes, but the value is in generating the inputs, not the scoring itself. AI is most useful for continuously analyzing behavioral data to identify conversion anomalies and surface opportunities a human would miss. The prioritization score is simple math; the hard part is generating accurate inputs, which is where AI provides leverage.
How do I measure whether my CRO prioritization process is actually working?
Track two metrics over time: your test win rate (the percentage of tests that produce a statistically significant positive result) and your average lift per winning test. If your prioritization is improving, both metrics should trend upward. A winner rate consistently below 20% suggests your inputs need better data, not a different framework.