
How to Reduce Marketing Cost: A Framework for Shipping More, Not Spending Less

TL;DR
- Stop measuring marketing efficiency with lagging indicators like MER or blended CAC. The only metric that matters for cost reduction is cost-per-shipped-change: your total marketing cost divided by the number of optimizations you ship per month.
- Audit People Costs, your largest line item. Replace expensive agency retainers and fragmented specialist contractors with platforms that bundle prioritization and implementation to lower your cost-per-shipped-change.
- Rationalize Tool Costs by auditing for overlapping functionality and tools that generate reports but no action. If a tool's output doesn't lead to a shipped change within two weeks, it's a tax on your stack.
- Optimize Campaign Costs by identifying the point of diminishing returns on your ad spend using incrementality testing. Reallocate budget from non-incremental campaigns to scaled creative testing to fight creative fatigue.
- Measure and reduce Process Costs—the invisible overhead of coordination, approval chains, and rework loops. This is often the largest source of waste and the biggest opportunity for savings.
Consider two B2B SaaS marketing teams, both with a monthly marketing budget of $120,000.
Team A is busy. They ship four website changes, two campaign adjustments, and one new landing page per month. Their total marketing cost—salaries, tools, ads, and agency fees—works out to a cost-per-shipped-change of roughly $1,700. They feel like they are moving as fast as they can.
Team B, with an identical budget, ships over 30 meaningful changes across their website, SEO, and campaigns in the same month. Their cost-per-shipped-change is just $400. Their marketing is over four times more efficient by the only metric that actually compounds: optimizations deployed.
Most articles on how to reduce marketing cost advise you to cut your budget, negotiate with vendors, or shift spend to cheaper channels. That is the wrong unit of analysis. The most effective way to lower marketing spend without losing results is to reduce your cost-per-shipped-change: how much it costs your team, in time and money, to move one optimization from idea to live.
This framework breaks down the four cost levers that inflate this number—people, tools, campaigns, and process—and provides practical benchmarks for B2B SaaS companies to build a more efficient marketing engine.
Why Cost-Per-Shipped-Change Is the Only Marketing Efficiency Metric That Matters
Most marketing teams track spending efficiency through lagging indicators. You look at your Marketing Efficiency Ratio (MER), your blended Customer Acquisition Cost (CAC), or your ROAS. These are useful for measuring outcomes relative to spend, but they completely ignore the throughput of the marketing system itself. They can't distinguish between a team that shipped fifty experiments cheaply and one that got lucky with two expensive campaigns.
This is where cost-per-shipped-change becomes the critical diagnostic metric.
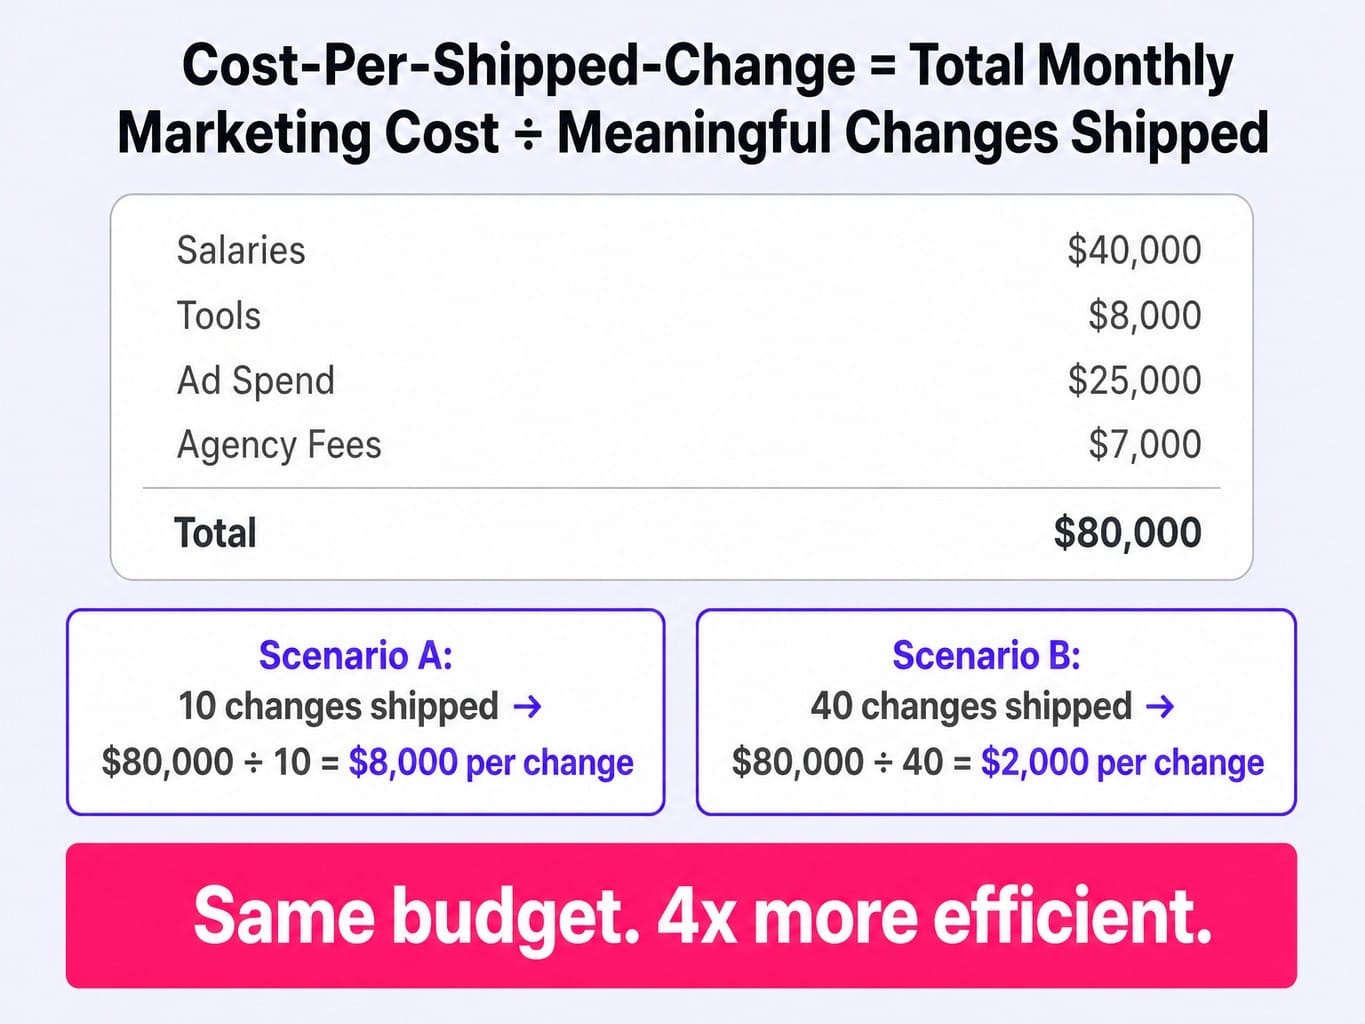
Cost-Per-Shipped-Change = Total Monthly Marketing Cost / Number of Meaningful Changes Shipped
A "shipped change" is any discrete optimization that goes live: a landing page variant, a new ad creative, a pricing page rewrite, a meta title update, or a campaign targeting adjustment.
Consider a three-person marketing team with a total monthly cost of $80,000, broken down as:
- $40,000 in salaries
- $8,000 in tools
- $25,000 in ad spend
- $7,000 in agency fees
If this team ships 10 meaningful changes in a month, their cost-per-shipped-change is $8,000. If they can reconfigure their system to ship 40 changes with the same budget, their cost-per-shipped-change drops to $2,000. The budget is identical, but the efficiency has quadrupled.
Based on performance data across the industry, cost-per-shipped-change for B2B SaaS teams ranges from $500 for high-velocity teams to over $5,000 for teams bottlenecked by manual workflows and agency dependencies. Calculating this number for your own team is the first step toward understanding where your marketing dollars are actually going.
People Costs: The Largest Line Item Most Teams Never Audit
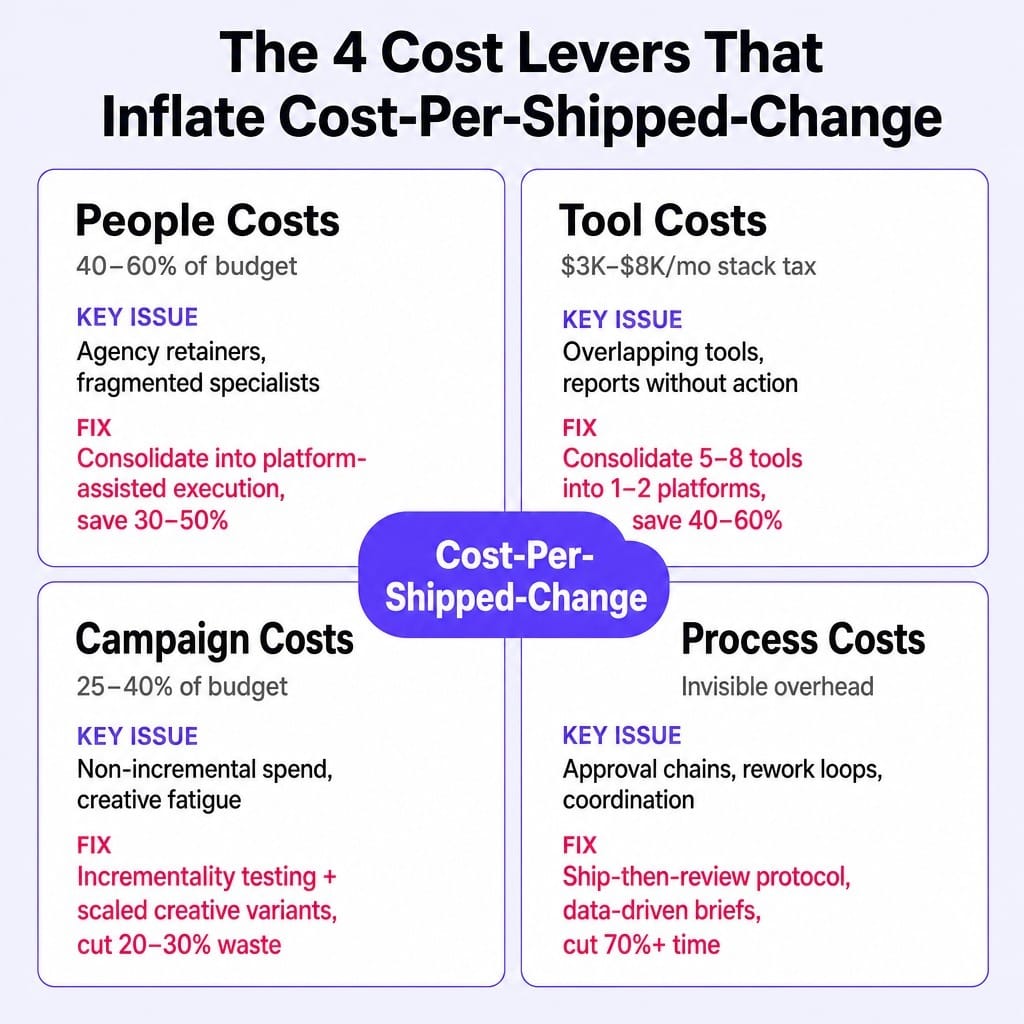
For most B2B SaaS companies, people costs—salaries, agency retainers, and contractor fees—represent 40-60% of the total marketing budget. The problem isn't that people are expensive; it's that most people-cost structures are optimized for channel coverage rather than execution throughput.
Process overhead that forces lean marketing teams into multi-day approval loops and manual QA cycles is the exact inefficiency that platforms like Spike AI are designed to collapse. The cost of not shipping a conversion-improving change for five extra days is real revenue left on the table, even though it never appears as a line item. When a team of three generalists spends most of its time coordinating handoffs instead of shipping work, its high cost is a system failure, not a headcount problem.
The goal is to reallocate spend from human coordination hours to systems that execute. Teams shifting from agency-dependent models to platform-assisted execution can often reduce this cost category by 30-50% while simultaneously increasing their shipping cadence.
The Agency Retainer Trap: Paying for Access, Not Output
The traditional agency model is built on selling access to expertise, not on delivering a specific volume of output. A typical CRO agency retainer of $8,000–$15,000 per month might yield two to four recommendations, with implementation then queued for another two to four weeks with your internal team. That's a cost-per-shipped-change of $2,500–$5,000 before accounting for the internal coordination time.
Many teams misclassify these retainers as campaign costs when they should be categorized as people costs, hiding the true ratio of human labor spend to actual output. The alternative isn't just firing the agency; it's replacing the retainer model with a system that bundles prioritization and implementation into a single, predictable cost structure. Calculate your agency's effective cost-per-shipped-change and compare it to platform alternatives that deliver the same quality of output with a guaranteed weekly shipping cadence.
Reducing Specialist Dependency Without Losing Expertise
Lean marketing teams face a constant dilemma: you can't afford a dedicated SEO lead, a CRO specialist, and a paid search manager. The common responses—hiring generalists who are spread too thin or engaging multiple contractors at $150–$250 per hour—both fail to reduce cost-per-shipped-change.
Why? Because neither approach creates a unified prioritization system. The SEO contractor and the paid search contractor optimize their channels in isolation, with no one deciding whether the highest-impact move is on the website, in search, or in an ad campaign. This fragmentation creates coordination overhead and sub-optimal resource allocation. The solution is to consolidate these fragmented specialist functions into a single intelligence layer that can identify the highest-impact move across all channels and then execute it.
Read more: How to Prioritize Marketing Channels With a Limited Budget And Resources (Framework for Lean Teams)
Tool Costs: How Your Martech Stack Quietly Eats Your Budget
Most marketing leaders can't name their total monthly tool spend without pulling up multiple invoices. The average B2B SaaS marketing team runs 12–20 distinct tools—for analytics, SEO auditing, A/B testing, email, attribution, and more—often costing between $3,000 and $8,000 per month in aggregate.
This is the "stack tax": the compounding cost of maintaining, integrating, and context-switching between point solutions that all surface insights but none of which implement a fix. You pay for Google Analytics 4, Supermetrics, and Triple Whale to get data, but the gap between the dashboard and a deployed change remains entirely on your team to close.
The most direct way to reduce marketing cost here is to audit your stack for tools that generate reports you read but never act upon. If a tool's output doesn't directly result in a shipped change within two weeks, it's a tax on your productivity, not an asset. Consolidating 5-8 of these point solutions into 1-2 platforms that combine intelligence with execution can often cut tool spend by 40-60%.
For a deeper breakdown of how to audit and consolidate your martech stack, see our guide to avoiding the Stack Tax.
Campaign Costs: Reducing Cost-Per-Lead Without Reducing Lead Quality
Paid campaigns on platforms like Google Ads and LinkedIn typically consume 25-40% of a B2B SaaS marketing budget. The common mistake is to cut costs by simply lowering the budget, which just reduces lead volume proportionally. The real lever for efficiency is reducing your marginal CPA—the cost of acquiring each additional lead.
Most campaigns hit a channel saturation curve. The first $5,000 of monthly spend might generate leads at an $80 blended CAC, but the next $5,000 pushes your marginal CPA to $200 as you exhaust the high-intent audience. The key is to identify the point on your spend-to-pipeline curve where your marginal CPA exceeds your ROAS floor and reallocate everything above that threshold. This often means cutting 20-30% of spend while losing only 5-10% of your lead volume, because you're eliminating the most expensive, lowest-quality leads.
Finding Wasted Spend With Incrementality Testing
Most teams can't spot campaign waste because they rely on flawed attribution models. Last-click attribution doesn't tell you which ad caused a conversion, only which one was last in the sequence.
The fix is incrementality testing, or holdout analysis. Pause a campaign for a specific geographic segment or time window and measure whether your overall conversions actually drop. If pausing a $3,000/month LinkedIn campaign results in no measurable decline in qualified pipeline, that spend was not incremental. Open-source media mix modeling (MMM) tools like Google's Meridian and Meta's Robyn can help you run these analyses without a dedicated data science team. As a rule, most teams find 15-25% of their campaign spend is non-incremental.
Read more: How to Build SaaS Marketing Attribution That Actually Drives Pipeline (Not Just Dashboards)
Creative Testing at Scale: Why One More Variant Beats One More Dollar
Often, what looks like a campaign cost problem is actually a creative fatigue problem. An ad or landing page that converted at 4% in month one decays to 2.5% by month three. The typical response is to increase spend to maintain lead volume, inflating your CAC.
The fix isn't more budget; it's more variants. A team that tests eight new landing page headlines per month on a $5,000 ad spend will consistently outperform a team that runs one static page on a $15,000 spend. This ties directly back to our core metric: each creative variant is a shipped change. The teams with the lowest campaign costs are the ones shipping the most variants, because fresh creative consistently resets the creative fatigue decay rate and keeps conversion rates high without requiring more spend.
Process Costs: The Invisible Overhead That Never Shows Up as a Line Item
The most significant marketing cost is the one that never appears on a spreadsheet: the time between identifying what needs to change and actually shipping it. I once ran a time audit on a seven-person marketing team and found that 31 of every 80 working hours per person were consumed by pure coordination: Slack threads for copy approvals, waiting on design assets, and re-briefing contractors. When converted to a fully loaded hourly cost, this invisible overhead exceeded the team's entire monthly paid media spend.
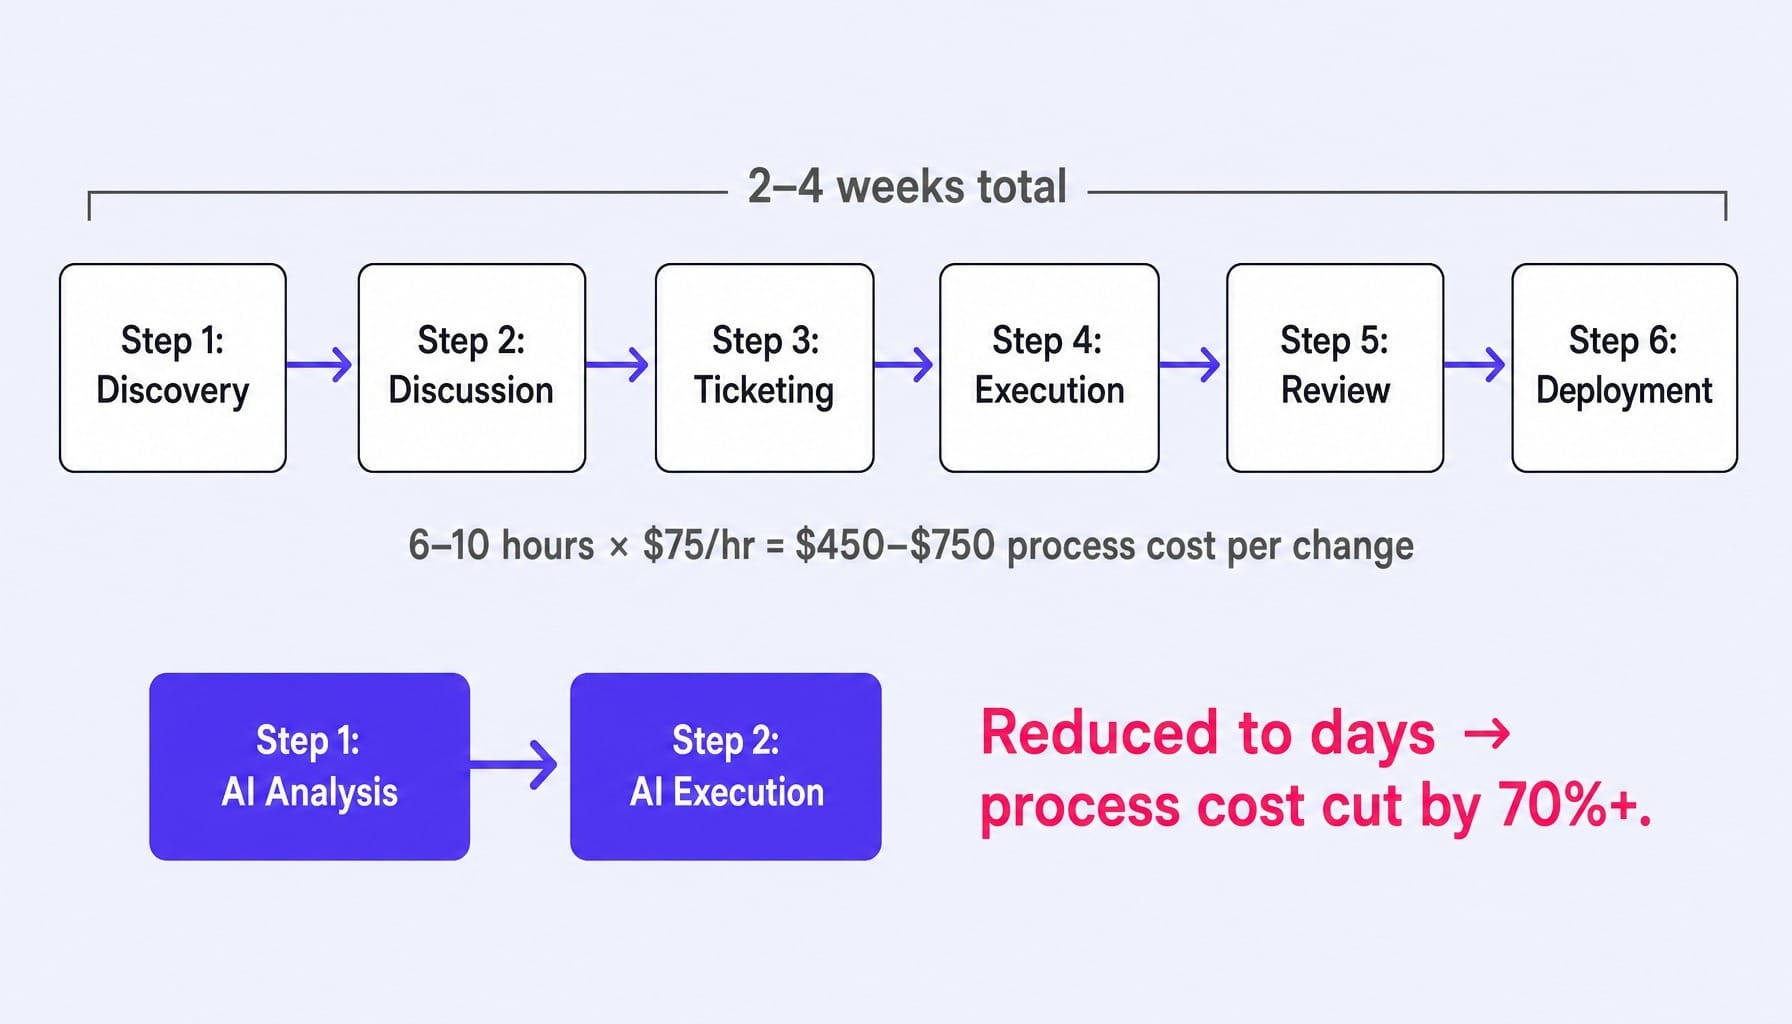
Consider the journey of a simple pricing page headline change. It passes through discovery, discussion, ticketing, execution, review, and deployment. This cycle can easily take two to four weeks and consume 6-10 hours of cumulative team time. At a blended rate of $75/hour, the process cost of shipping that one change is $450-$750. That's before you even count the opportunity cost of the suboptimal page remaining live for those weeks. Reducing your average time-to-ship from weeks to days can cut this process cost by over 70%.
The Approval Chain Tax: How Stakeholder Reviews Kill Shipping Velocity
Approval chains are the single largest multiplier of process costs. Each additional stakeholder in a review cycle adds latency and increases the probability of rework as conflicting feedback emerges. A team with a two-person approval process consistently ships more than a team with a five-person process, not due to competence, but because the system itself has less friction.
The practical fix is to establish a "ship-then-review" protocol for low-risk changes like copy updates or CTA variants. Reserve multi-stakeholder approval for high-risk changes affecting pricing or brand positioning. This simple change in protocol can dramatically lower your cost-per-shipped-change.
Rework Loops: Why Most Marketing Teams Ship the Same Change Three Times
Rework is the hidden tax on every shipped change. A landing page goes through V1 (initial build), V2 (post-feedback revision), and V3 (post-launch fix), effectively tripling the cost of that one optimization. This happens when briefs are vague, feedback is contradictory, or teams lack data and default to opinion-driven iteration.
The structural fix is to replace opinion-driven briefs with data-driven prioritization. When a system can tell you precisely what to change and model the expected impact, the first version you ship is far more likely to be the final one. Rework inflates your total cost without increasing the number of changes shipped, destroying your efficiency.
What Happens When You Reduce Cost-Per-Shipped-Change to Near Zero
The core tension is clear: your real cost problem isn't your budget size, it's your shipping velocity. People costs, tool fragmentation, campaign waste, and process overhead all conspire to inflate the cost of every single change you ship.
So, what would it look like if prioritization, execution, and measurement were collapsed into a single system?
This is the system Spike AI provides. Instead of giving you another dashboard, Spike AI functions as a marketing execution engine that identifies the highest-impact change across your website, SEO, or ads, and then ships it. Every week.
Where a typical process takes three weeks and costs over $750 in team time per change, Spike AI compresses the entire cycle—diagnosis, prioritization, implementation, and measurement—into a continuous weekly loop. This isn't just about doing things faster; it's about fundamentally changing the unit economics of your marketing. You move from shipping a few expensive, slow changes per quarter to shipping dozens of small, fast, compounding changes per month.
This is the alternative to being stuck between an expensive agency that ships slowly and an overwhelmed in-house team that ships inconsistently. The result is a marketing function that runs on a cadence, where each week's results feed the next week's priorities.
See how Spike AI reduces your cost-per-shipped-change — book a discovery call
Your Marketing Doesn't Have a Budget Problem
Reducing marketing cost isn't about spending less; it's about shipping more per dollar spent. The four cost levers—people, tools, campaigns, and process—all share a common failure mode: they inflate the cost and latency of moving one optimization from idea to live.
Teams that measure and relentlessly reduce their cost-per-shipped-change will always outperform teams that simply cut budgets. Lower cost-per-change creates a compounding advantage: more changes shipped means more data generated, which leads to better prioritization, higher-impact optimizations, and faster growth from every marketing dollar.
Here's a challenge: calculate your team's cost-per-shipped-change. Divide your total monthly marketing spend by the number of meaningful changes you shipped last month. If that number is over $1,000, you don't have a budget problem. You have a throughput problem.
Frequently Asked Questions
What is a good marketing efficiency ratio (MER) for a growing B2B SaaS company?
MER is total revenue divided by total marketing spend. For growing B2B SaaS companies, a healthy MER is typically between 5:1 and 10:1. A ratio below 3:1 often signals inefficiency or that paid spend has hit diminishing returns. However, MER measures output but not execution efficiency; you can have a strong MER while still having a high cost-per-shipped-change.
How much should a B2B SaaS company spend on marketing as a percentage of revenue?
As a benchmark, B2B SaaS companies at $5-30M revenue typically spend 10-20% of revenue on marketing. Earlier-stage companies often spend 15-20%, while more established ones are closer to 8-12%. The percentage matters less than the output, however. A company spending 12% that ships 30 optimizations a month will outgrow one spending 18% that only ships five.
What marketing costs should I cut first during a downturn?
Start with non-incremental spend—campaigns where pausing them causes no measurable drop in conversions. Next, audit tool subscriptions for unused seats and overlapping features. Cut top-of-funnel brand and awareness spend last. The negative impact of these cuts has a 3-6 month revenue decay lag, meaning the damage won't be visible immediately but will compound in later quarters.
Can content repurposing actually reduce marketing costs significantly?
Content repurposing reduces the production cost per asset, but it only reduces your cost-per-shipped-change if the repurposed content is deployed as a distinct, measured optimization. Turning a blog post into a LinkedIn carousel saves time, but the real savings come from turning high-performing content into conversion-focused assets like landing page copy or ad creative, where each variant is a new "shipped change."
How do I calculate if my customer acquisition cost is too high?
Compare your blended CAC to your customer lifetime value (LTV). For B2B SaaS, a healthy LTV:CAC ratio is at least 3:1. If your ratio is lower, analyze your marginal CPA by channel to find which ones are dragging down the average. The issue is rarely that all CAC is too high, but that a portion of your spend is going to channels with a marginal CPA 3-5x higher than your average.
How do I build an organic marketing engine that eventually replaces paid spend?
An organic engine changes the ratio of spend, it doesn't eliminate it entirely. The goal is to shift from a 70/30 paid-to-organic lead mix to 30/70 over 12-18 months by investing in compounding assets like SEO and content. Track the percentage of qualified pipeline originating from organic channels. Once organic contributes over 50% of your pipeline, you can reduce paid spend proportionally without losing volume.